Anti-LGBT Hate Crimes Are Rising
But We Really Don’t Know How Much
 Last Updated on Jun 14, 2026
Hate crimes targeting LGBT individuals have climbed for the past four straight years, according to data published by the FBI. While such hate crimes do not account for the majority of all hate crimes reported by the FBI (racially motivated hate crimes are by far the most common), the fact that such incidents are growing more frequent is a cause for concern and special attention.
The long history of violence against gay men, lesbians, bisexuals and the transgender/gender-nonconforming community is becoming increasingly well-understood, but it shows no signs of stopping. Furthermore, transgender people of color are disproportionately affected. In 2024, 78 percent of transgender homicides involved victims of color, and 56 percent were Black transgender women, according to the Human Rights Campaign.
While not all of those killings were results of hate-inspired violence, their deaths highlight the increased risk that many members of the LGBT+ community face. If we take apart the FBI’s most recent hate crimes publication, individuals who identify as LGBT+ are more likely to become hate crime victims than African-Americans, Hispanics, Asians, Muslims, or Jews.
How has the picture of hate crimes targeting the LGBT community changed over the years and where are such crimes most common across the country? To better understand the prevalence of these incidents, we’ll examine the FBI’s data on hate crimes against LGBT individuals, but we’ll also explore the limitations of that data, including why it’s possible that the FBI could be underestimating hate crimes against all targeted groups by as much as 96%.
Anti-LGBT Incidents on the Rise
Hate crimes in the United States have been trending upward for years, with anti-LGBT crimes being no exception. There is some hope, though. According to FBI data, the proportion of hate crimes targeting members of the LGBTQ+ community among all hate crimes has declined slightly in recent years. That doesn’t discount the fact that anti-LGBT hate crimes remain at historically high levels. If we take a longer view, we see that the proportion of hate crimes targeting LGBT+ individuals has gone up by more than one-third since the late 1990s.
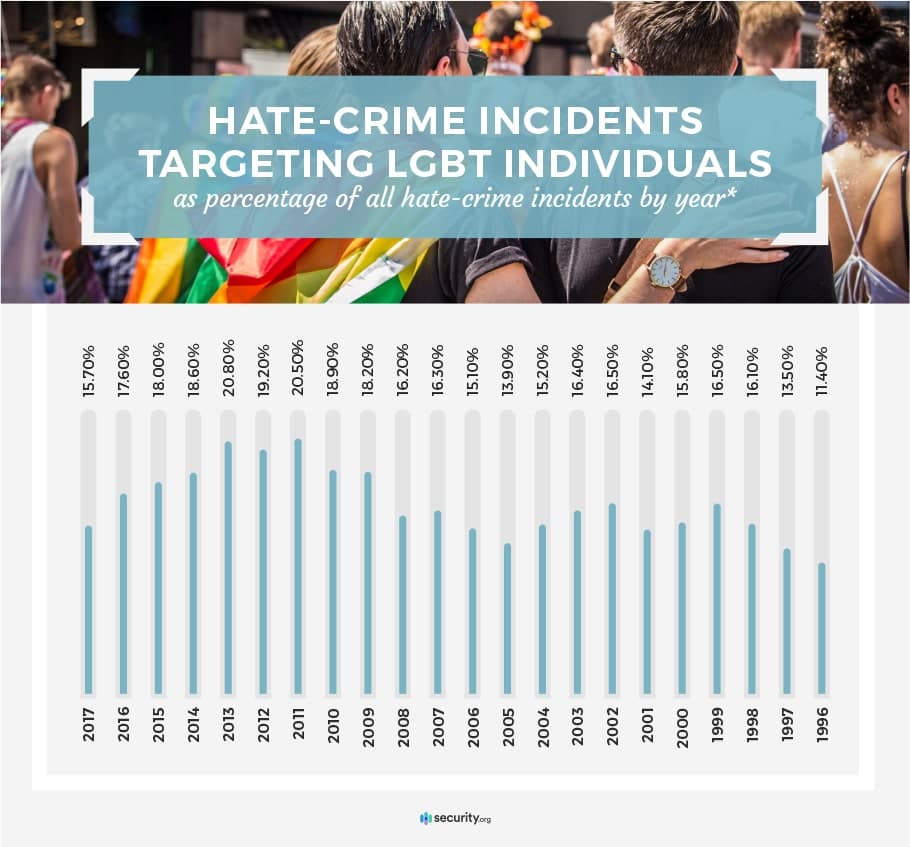
* The FBI defines these incidents as being motivated by bias against the group in question. The percentages listed here include crimes motivated by the presence or perceived presence of a victim who was gay, lesbian, bisexual, LGBT, transgender or gender-nonconforming. Until 2013, no specific categories existed for trans or gender-nonconforming individuals. This figure includes all incidents, which may consist of more than one offense and/or multiple victims.
The ratio of anti-LGBT incidents among all hate-motivated incidents reached its peak in 2013, when more than 1 in 5 bias-motivated incidents involved victims who were LGBT+ or were perceived as such. Since then, the proportion of anti-LGBT incidents among all hate-motivated incidents has fallen, with the rate falling about 10% between 2016 and 2017 alone.
Gay men are more likely than other members of the LGBT community to be targeted in hate-motivated incidents, with more than half of incidents motivated by anti-LGBT sentiment targeting gay men. But this ratio has fallen over the past few years and is down from more than 60% in 2013.
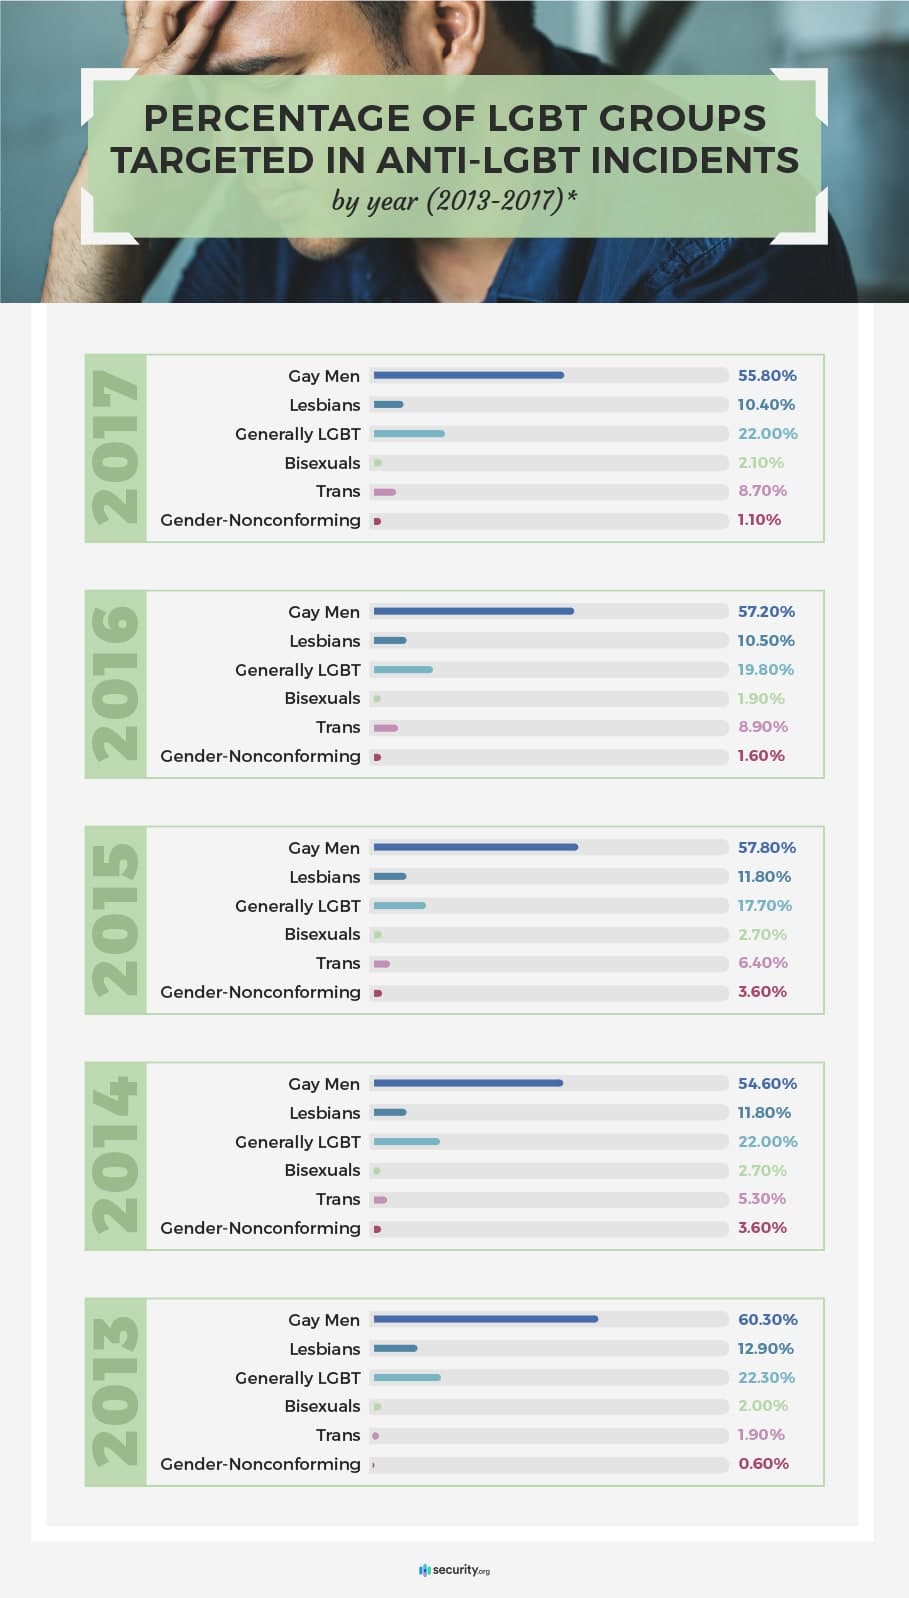
* Until 2013, the FBI data did not collect data on hate incidents targeting transgender or gender non-conforming people, so for comparison’s sake, we’ve included only the past five years.
Incidents targeting Black people are the most common among all hate-motivated incidents, but members of the LGBT community are more likely than any targeted group to be victimized by hate incidents when accounting for each group’s representation in the overall U.S. population. For instance, while more incidents target African-Americans than any other group, there are more than 43 million Black Americans, compared with an estimated 11.4 million Americans who identify as LGBT+, meaning that victims of hate-motivated incidents are more likely to be LGBT than Black.
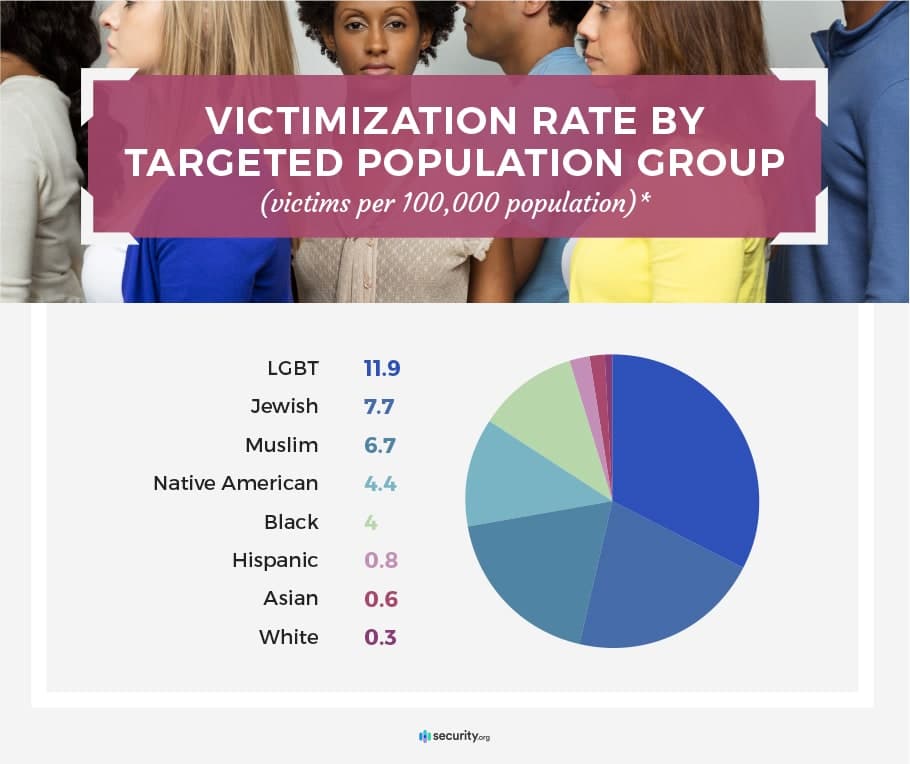
* This figure was calculated by dividing the number of victims in each group by their overall estimated numbers in the U.S. population and multiplying by 100,000.
Where in the U.S. Are Anti-LGBT Hate Crimes Most Common?
Before we can discuss how frequently the LGBT community is targeted by hate incidents in various states and cities, it’s important to understand one of the major limitations with the FBI’s data: Many law enforcement agencies do not report such crimes to the FBI, and even the very definition of what constitutes a hate crime varies from state to state and, often, city to city.
Even incidents that the FBI itself has investigated sometimes are not included when the agency releases its data, and for other states, their low numbers strain credulity. Law enforcement agencies in Alabama, for instance, reported just 9 bias-motivated incidents took place in the state; compare that to the 379 incidents reported in Kentucky, which is similar in population to Alabama. Hawaii collects its own data that the FBI does not include in its report, and the state said only 3 credible hate-crime incidents took place.
More than half of the states reported fewer than 10 hate crimes that targeted LGBT individuals, though only four states said none took place. A total of 31 states, according to the FBI, had no incidents targeting trans or gender-nonconforming individuals.
Still, California had by far the highest number of incidents targeting all LGBT people. After adjusting for population differences, California drops — but not by much.
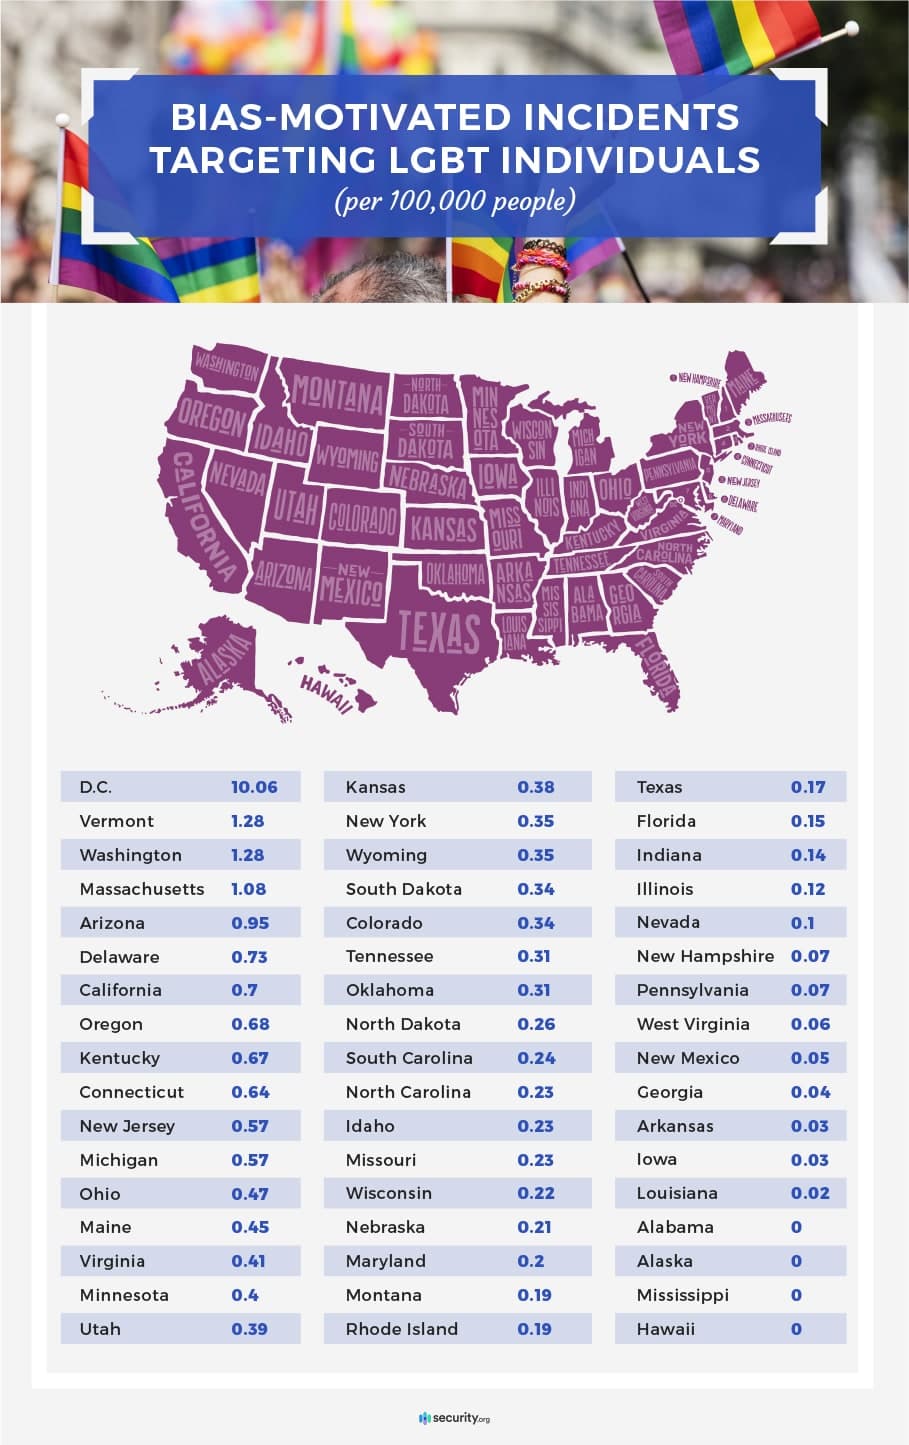
Overall in the U.S., bias-motivated incidents target LGBT people at a population-adjusted rate of about 0.37 per 100,000, which means that the majority of states have rates lower than the national rate.
While the rate is highest in the District of Columbia, that’s likely owing largely to the fact that D.C. has a relatively large LGBT population but a small population overall. Another way of understanding how prevalent anti-LGBT incidents are in each state is to look at these incidents relative to all hate-motivated incidents. In other words, of a state’s hate-motivated crimes or incidents, what percentage targeted the LGBT community?
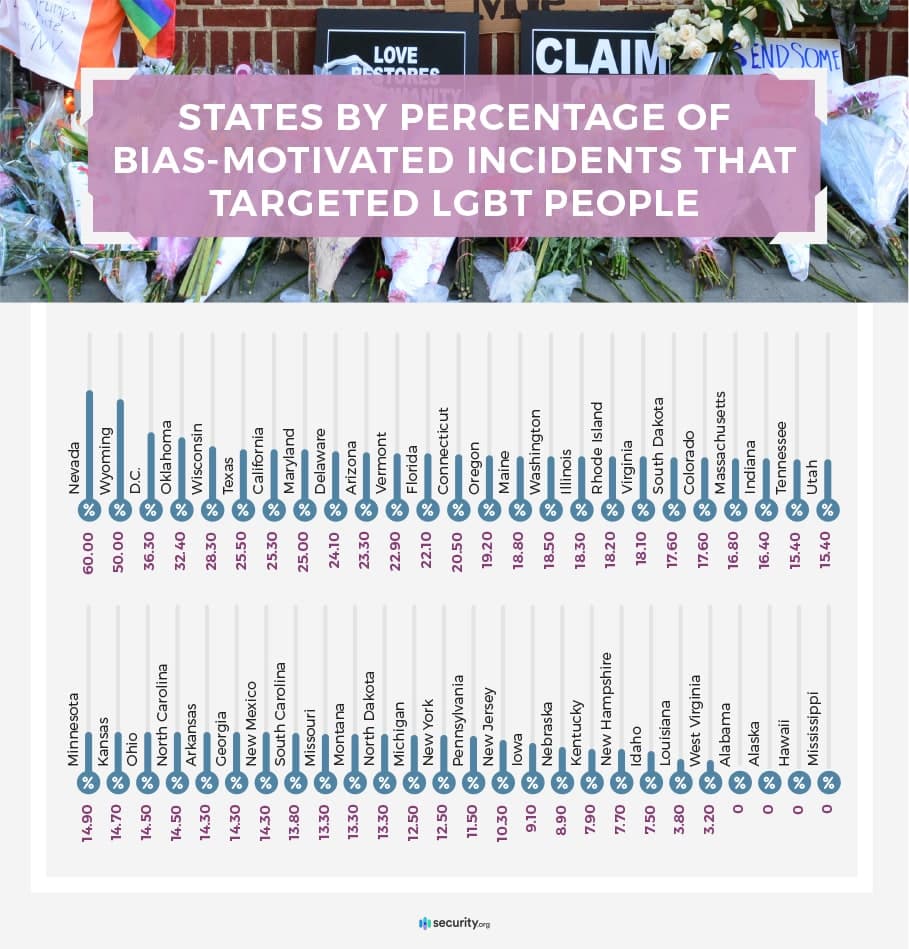
These figures include all incidents based on sexual orientation, which folds in a small number of crimes targeting straight-identifying people, but they are nonetheless quite interesting. In both Nevada and Wyoming, at least 1 in 2 hate-motivated incidents targeted people based either on their sexual orientation or gender expression. Nationally, this rate is about 17%, putting 21 states over the total U.S. level.
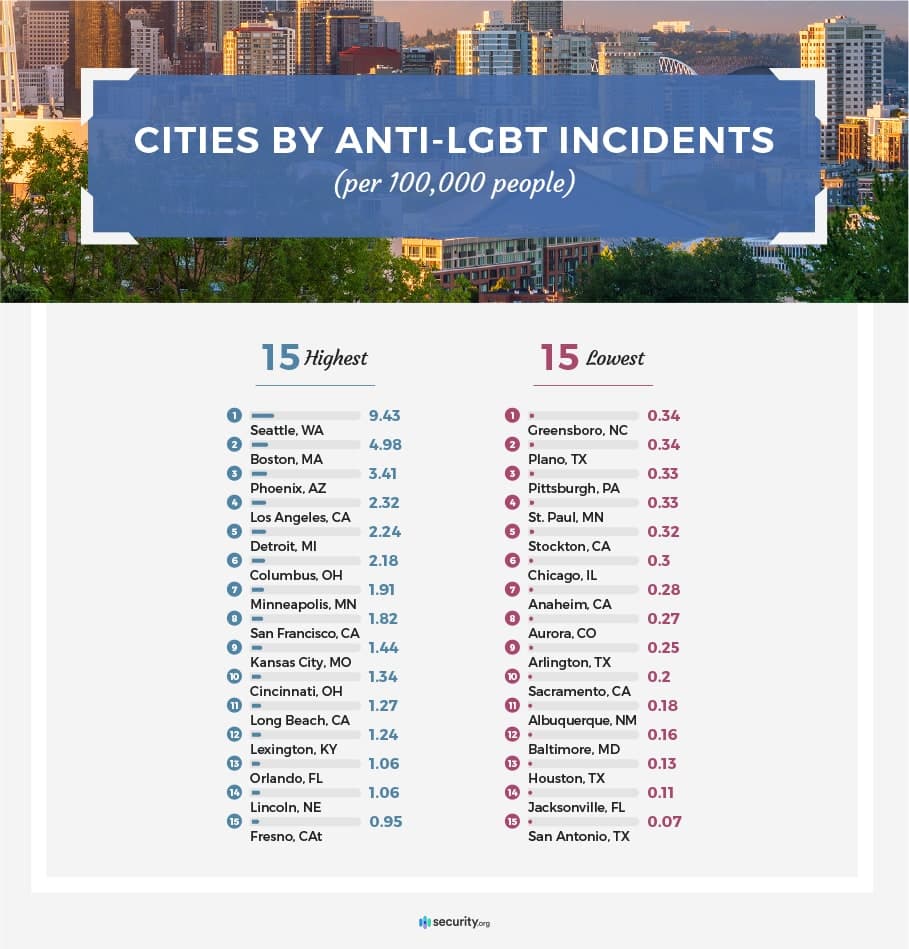
Excluding Washington, D.C., Seattle has the highest rate of hate-crime incidents targeting LGBT people among large cities for which data was available. Again, our analysis is limited by the fact that not all law enforcement agencies report data, and we limited our analysis to large cities (at least 250,000 in population) in which any hate crime data was reported.
Two of the cities with the highest rates are in Ohio, while two others are in California.
But That’s Not the Whole Story, Right?
While we can see from what the FBI has reported that hate-motivated incidents targeting the LGBT community have become more commonplace over the past half-decade, we really don’t know the full scope of the issue. That’s for a variety of reasons.
First, most people who are targeted by bias-motivated actions or words do not report what happened to the police. It may be because they don’t think it rises to the level of a crime, they fear not being believed or facing retaliation, or they simply choose not to engage with the legal system. In fact, the Bureau of Justice Statistics estimates that the vast majority of hate crimes go unreported to police.
Second, much of the data from the FBI just feels off and seems to fail the sniff test. Plus, the FBI ignores the data it gets from Hawaii. Third, there is no single national definition of what a hate crime is, laws vary widely across states, and there’s not always agreement about which groups deserve protection. It wasn’t until 2013 that transgender people and those who are gender-nonconforming were even included.
So what is the true figure? How common are hate crimes targeting the LGBT community? According to the Bureau of Justice Statistics, which publishes an annual, self-reported survey on criminal victimization, more than 200,000 people are victimized by hate crimes in a given year. That’s well over 25 times higher than the bias-motivated figures the FBI reports.
Not only that, but the BJS figures indicated that a higher percentage of hate crimes target LGBT individuals — to the tune of nearly 26%. If true, that would mean the FBI’s data is undercounting the prevalance of anti-LGBT crimes by more than 70%.
Conclusion
June 28, 2019, marked the 50th anniversary of the Stonewall Uprising, seen by many as the spark that ignited the modern gay-rights movement in the U.S. The first gay pride marches were held the following summer, and while there’s no question that a lot has changed since police showed up at the door of the Stonewall Inn in New York City’s Greenwich Village, for many members of the LGBTQ+ community, violence, harassment, and even the threat of murder are still part of everyday life.
It may no longer be a crime in this country to be gay, but hate crimes against LGBTQ+ people remain a serious concern, and members of that community continue to be among the most likely of any group to be targeted in hate-motivated attacks. For those who are LGBTQ+, that reality is a sobering reminder of how much work remains to be done.
About This Story
As mentioned, the bulk of our data came from the Federal Bureau of Investigation’s annual hate crime publication; these reports can be accessed here. Hawaii’s data was retrieved from the reports found here.
Not all victims of the incidents reported by the FBI are U.S. residents, but to calculate how common it is for various groups to be targeted, we used various reported and estimated figures for the size of each population. Several sources were consulted, including the U.S. Census Bureau (here and here), Pew Research Center, Haaretz, the UCLA School of Law Williams Institute and Gallup.
Fair Use Statement
The data and images on this page are free for noncommercial uses. If you want to share these materials with your readers, please simply provide a link back to the URL of this page to give proper credit.