Best & Worst Cities for Police
Though it’s still perceived as one of the most trusted institutions in the country, the public’s trust in law enforcement has been shaken over the past few years. According to Gallup, the percentage of people with a favorable view of the police has fallen by 7% since 2017 and stands near the levels seen just after the Rodney King verdict.
While trust in law enforcement may be fluctuating, the police still have the third-highest approval rating of all institutions, behind only the military and small business. Plus, being an officer remains one of the most oft-cited childhood dream careers.
More than 800,000 people are employed as police officers in the U.S., and the average police officer makes more money than the average worker among all occupations. But how do cities fare when it comes to attractiveness for police officers?
In which cities can they expect to make the most money, where are they most likely to find jobs, and where are they least likely to face life-threatening situations while on the job? We’ve examined data for hundreds of U.S. cities and metro areas across an array of metrics to discover which cities are the best (and worst) for police.
We’ll compare data on income, safety, employment and cost of living to determine which cities lead the way for police and which ones officers may want to avoid. Jump to the bottom of the page to see our detailed methodology.
Income
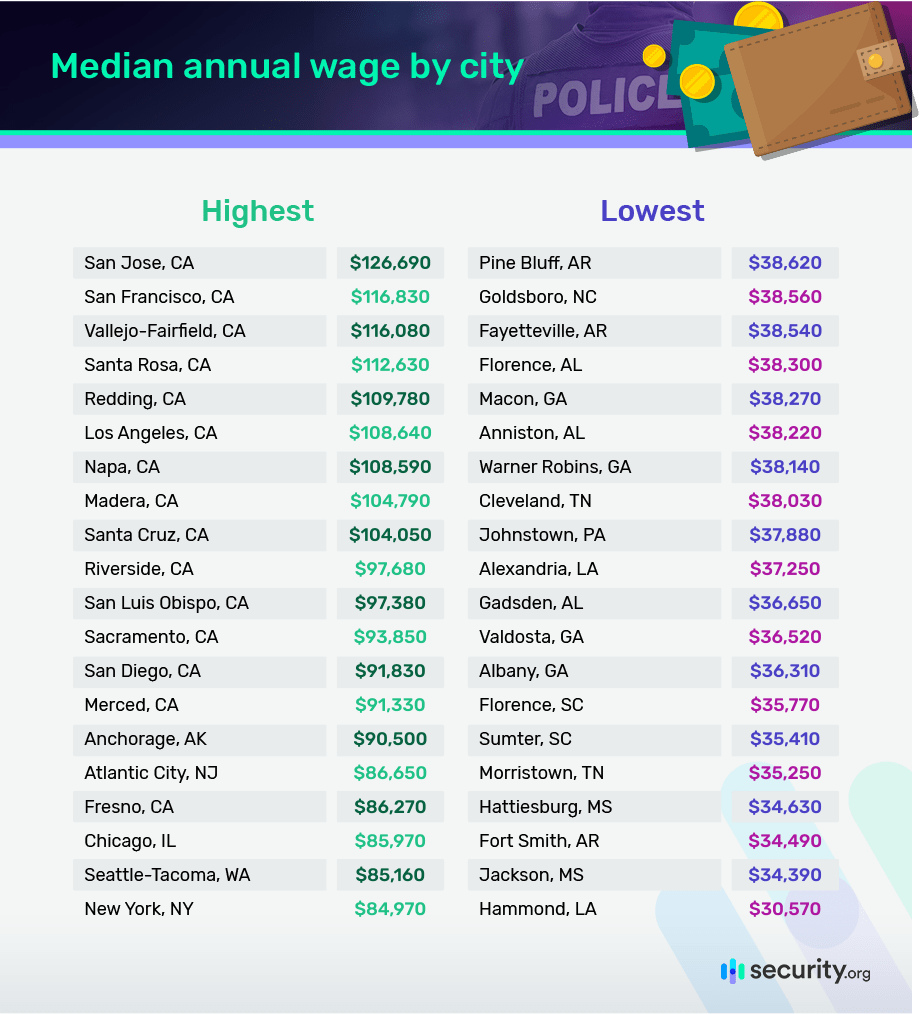
The median annual wage for police and sheriff’s patrol officers, the occupation that most police officers fall into, is $61,380, which is far higher than the total median annual wage for all jobs, which is $38,640, according to the U.S. Department of Labor. But this figure varies pretty dramatically, depending on where in the country you’re looking.
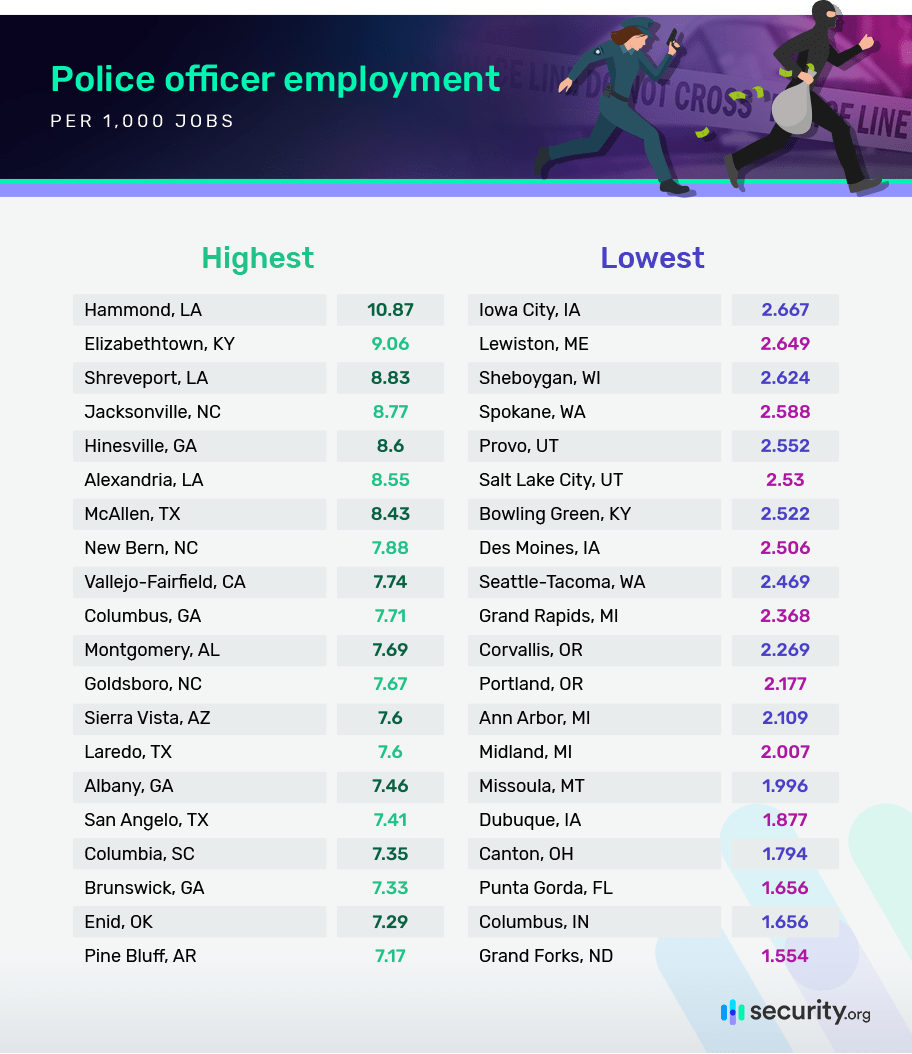
For instance, police in Hammond, Louisiana make just over $30,000 a year, while cops in San Jose, California earn wages in the six figures.
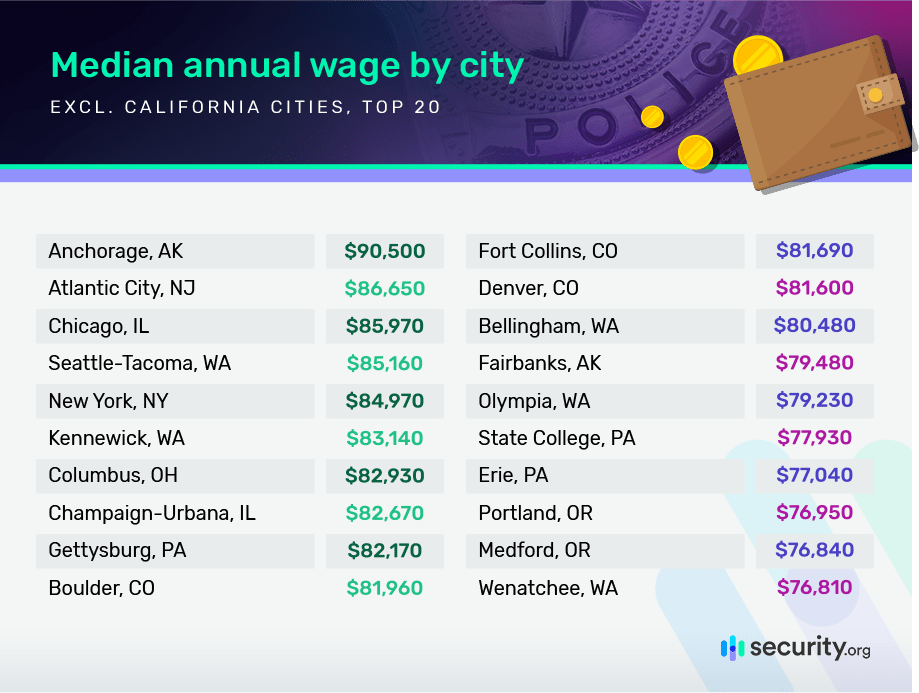
Perhaps not surprisingly, the 14 highest-paying cities for police officers are all in California, so let’s take a look at the list without those cities.
Safety
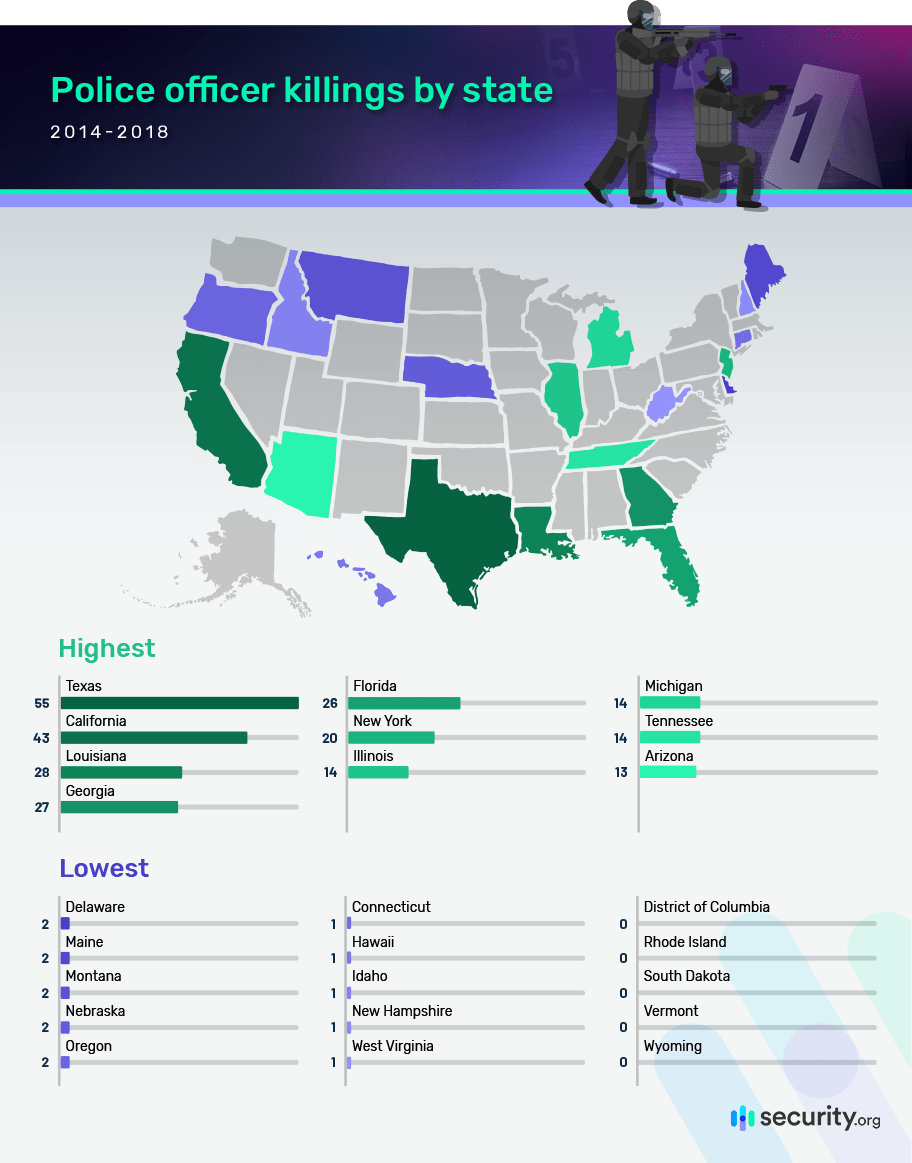
Hundreds of police officers are killed or injured every year in the line of duty, whether accidentally or deliberately. In 2018, for example, there were more than 100 law enforcement officer deaths according to data from the Federal Bureau of Investigation. Of those, 51 were accidental while 55 were found felonious.
While the number of officers killed illegally that year represents an increase from the previous year (46 felonious killings), that figure is down from a high of 72 back in 2011.
On a less grim note, four states – Rhode Island, South Dakota, Vermont, and Wyoming – and the District of Columbia didn’t record any killings of police officers, whether accidental or deliberate, in the five years when data was gathered.
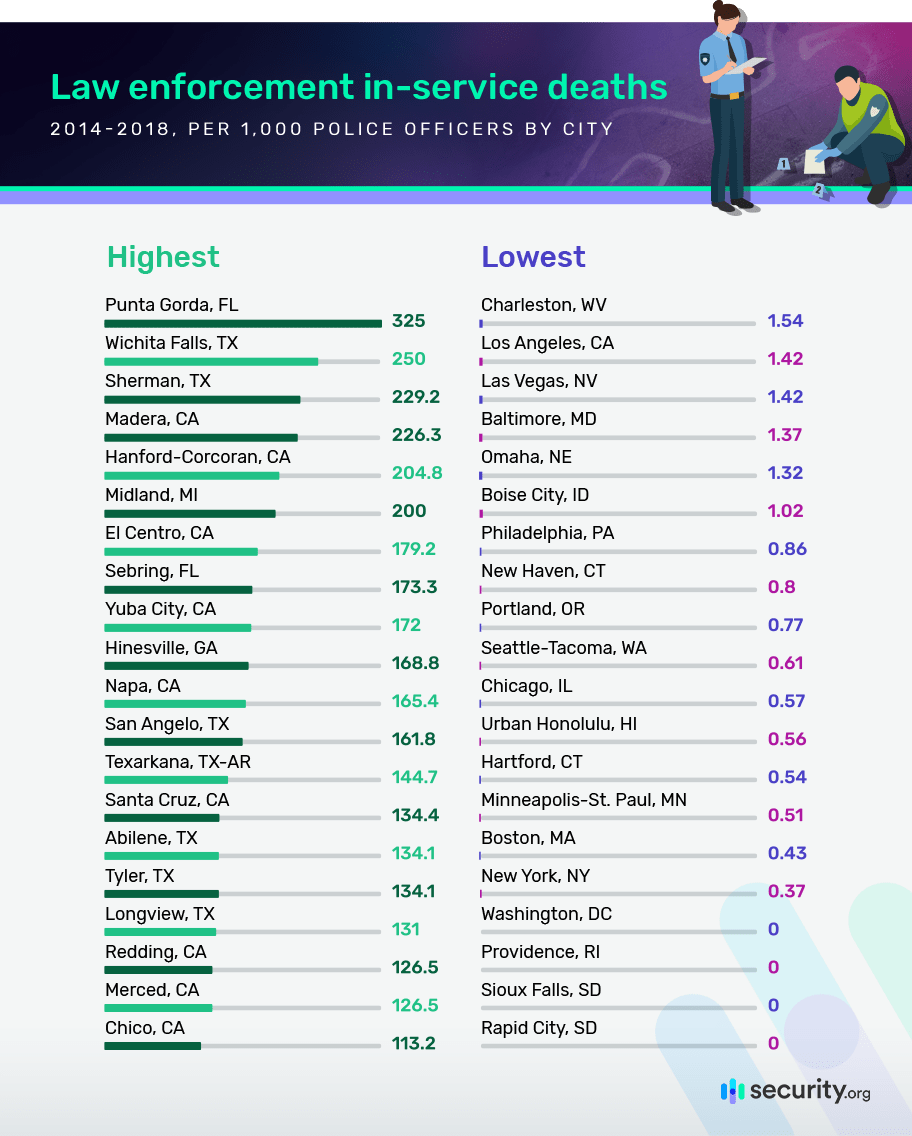
The FBI’s data does not specify in which city each officer was killed, but by comparing state-level data on killings of law enforcement officers with employment levels of police in each city, we can paint a picture of how dangerous being a cop in each town is likely to be.
Employment
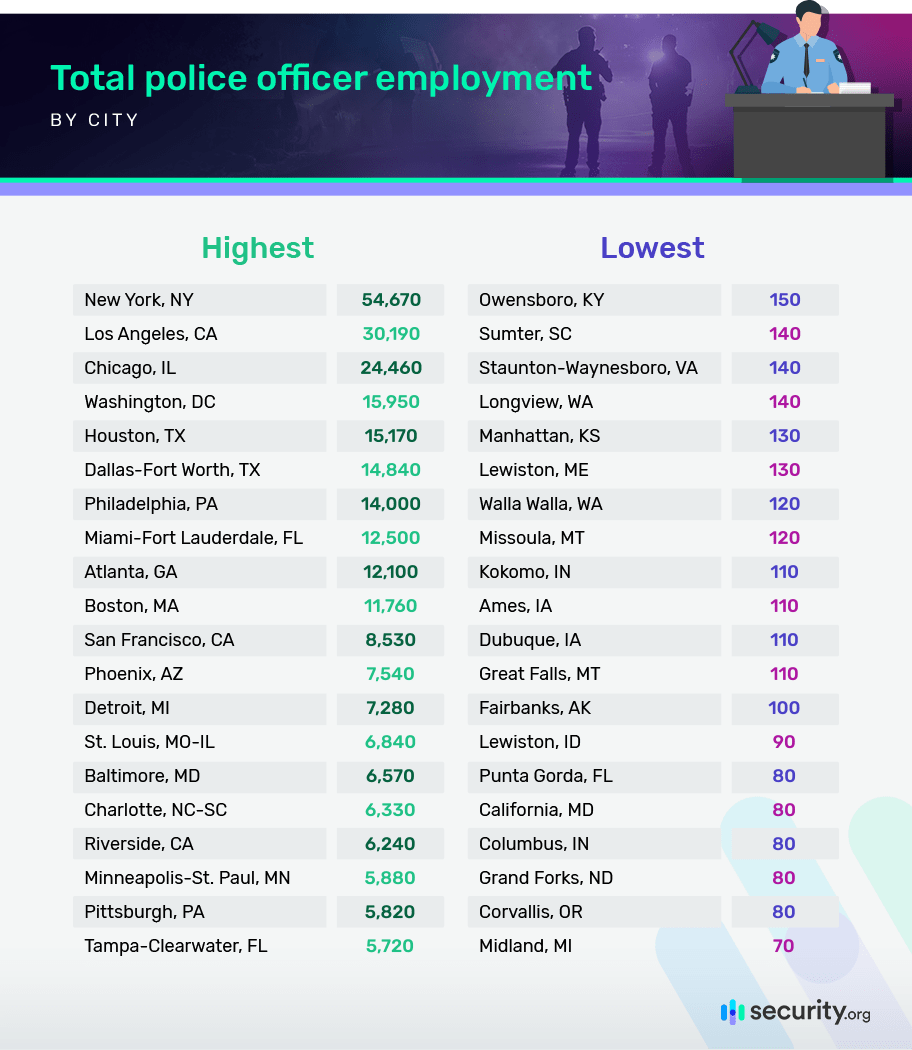
Availability of jobs is one of the biggest aspects to considering where to begin or continue a career. Among the 300-plus cities on our list, the average town has nearly 1,700 police officers, ranging from the 54,000-plus employed in the New York metro area to the few dozen employed in Midland, Michigan.
Another way of understanding the prevalence of jobs is to factor in overall employment in an area. In other words, which cities have the highest concentration of police jobs?
Cost of Living
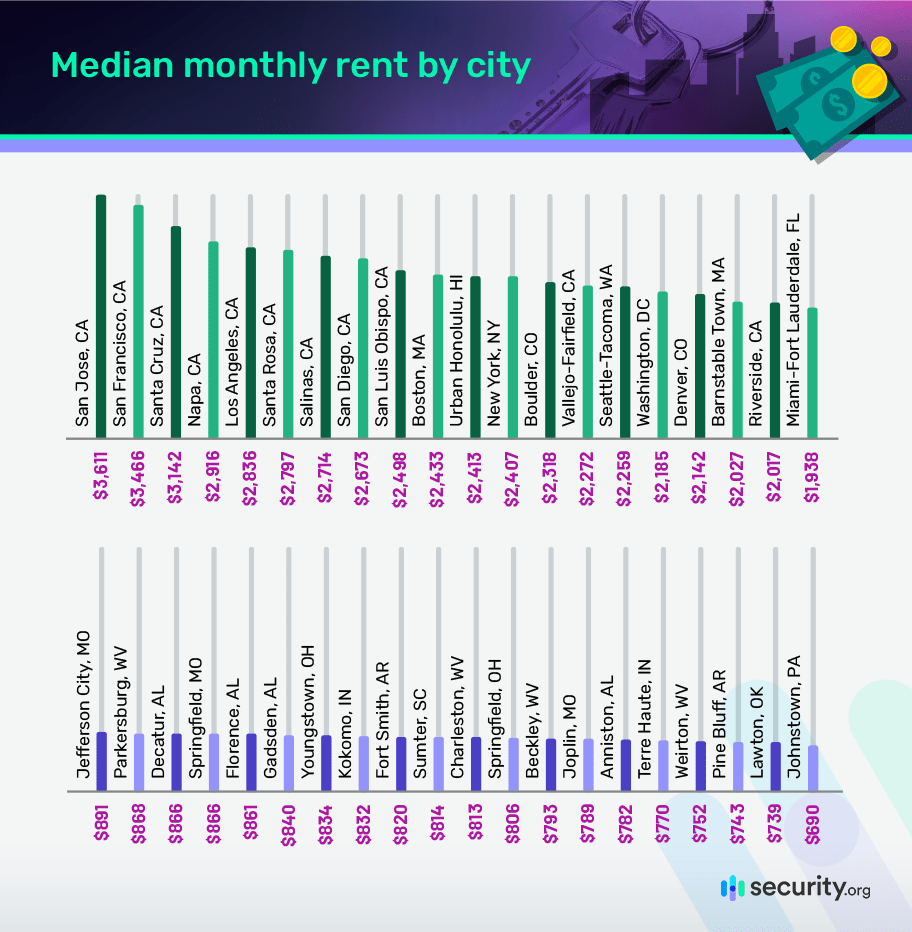
Finding a safe job that pays well is only part of the battle — now comes the time to actually spend the money you earn. A key marker of cost of living is the price of rent in an area. We’ve all heard horror stories about $5,000-per-month San Francisco studio apartments, but what does the data say today about how expensive various cities are?
How far will a cop’s salary go in each of our cities? Yes, the top of the rent list is dominated by California cities, but many of those same cities top the salary charts, too, so which cities provide the best balance?
Best & Worst Cities
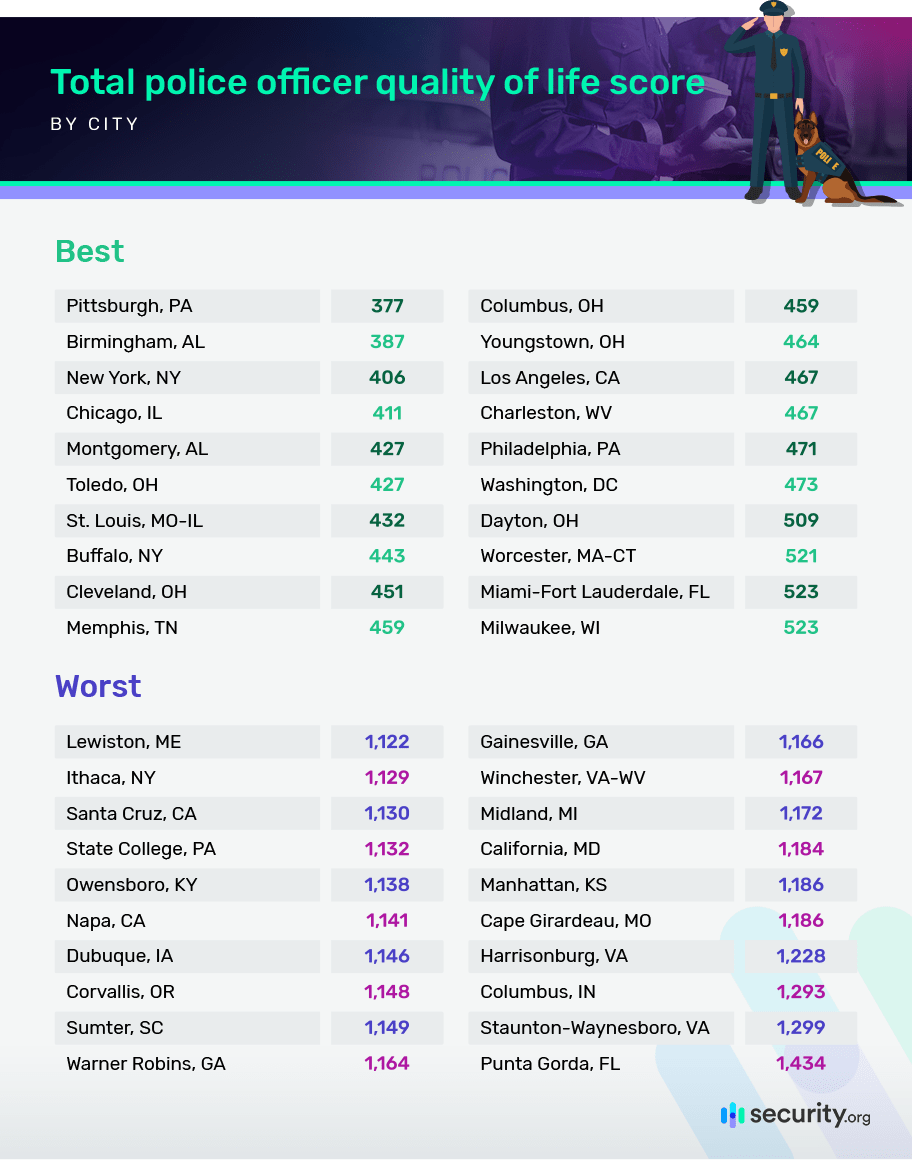
So which cities provide the best of all worlds for police officers — and which provide the worst? To rank our 300-plus cities, we took the data we’ve shared already and ranked each city from best to worst (which is not always highest number to lowest number). Each city was then assigned a number depending on how it ranked among all the cities, and those numbers were totalled to create an overall ranking for each city in which lower numbers equate to better quality of life for police officers.
Our lowest score was 377 (Pittsburgh, Pennsylvania) and our highest was 1,434 (Punta Gorda, Florida).
Conclusion
Life as a police officer is routinely a thankless one, and it’s sometimes a very dangerous one. Not only that, but officers are regularly used as political props for individuals on all sides of the ideological spectrum. For the police officers who got into law enforcement for the right reasons — protecting the public and serving the common good — these negative aspects can be taken in stride. But, as we’ve seen quite clearly, life for police officers is not exactly the same across the country, and a few cities seem much more attractive for the average cop.
Methodology
To quantify which cities are best and worst for police officers, we examined data across several areas, including income, safety, employment and cost of living. As mentioned, the overall ranking of cities was done by creating a 1-318 ranking in each category, adding each city’s rankings together and comparing them.
- Income: Our data included monthly income by city for police and sheriff’s patrol officers, and these figures were compared to monthly rent costs in each city. Wage information for Champaign-Urbana, Illinois, Clarksville, Tennessee, Decatur, Alabama, Madera, California and Tucson, Arizona was unavailable, so for overall state figures for each city were substituted. Data on income and employment was gathered by building custom tables via the U.S. Department of Labor’s Bureau of Labor Statistics Occupational Employment Statistics Query System.
- Safety: In this area, we included figures from the Federal Bureau of Investigation on law enforcement officers killed in the line of duty, whether feloniously or accidentally, over the past five years. This information was published in 2019 and can be accessed here. The FBI does not provide this information by city, so in each case, state-level figures were substituted. In addition to the number of law enforcement officers killed in each state over the past five years combined, we included the number of officers killed per 1,000 officers employed in each city.
- Employment: Our data in this area included overall employment of police and sheriff’s patrol officers by city, employment of police and sheriff’s patrol officers per 1,000 jobs overall and officers killed in the past five years per 1,000 police and sheriff’s patrol officers employed. Police officer employment per 1,000 jobs for Ames, Iowa, Salinas, California and Tallahassee, Florida was unavailable, so the overall state figures for each city were substituted. Total employment of police for Ames, Iowa, Salinas, California and Tallahassee, Florida were unavailable, so figures for similarly sized cities in each state were subbed.
- Cost of living: In this area, we consulted the Zillow Rent Index database, which is a measure of the median market rent in each city, and this figure was used on its own as well as being compared to monthly wage figures.
Fair Use Statement
The information and images on this page are free to share for noncommercial purposes. If you wish to distribute any of the information contained, please provide a link back to the URL of this page to ensure proper credit is given.


