City Crimes Involving Guns
Analyzing Gun Incidents In Major U.S Cities
 Last Updated on May 13, 2026
From skeet shooting to self-defense, guns are woven into the United States’ DNA. While it’s nearly impossible to nail down an exact number, Americans own an estimated 400 million guns – a number that accounts for nearly half of the entire world’s civilian-owned firearms. With a U.S. population of roughly 335 million, that means there are more guns than people in the country.
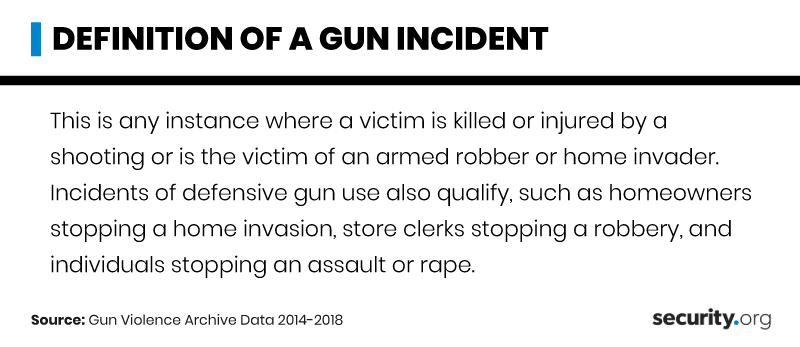
Even though the prevalence of firearms is not necessarily correlated with violence and increasing or decreasing rates of gun incidents may relate to changes in policing, gun crime is still a hot-button issue in the U.S. (although it is important to note that suicides outnumber homicides when it comes to firearm-related deaths). With gun control as a mainstay topic in the news, we wanted to learn more about gun crimes occurring in major American cities. Here are our findings and conclusions based on data from the Gun Violence Archive.
Most Violent Cities

St. Louis, Missouri, has long been known as a city plagued by violent crime. In 2017, the city recorded 66 homicides per 100,000 residents – 10 times the national average at the time. More recent data continues to paint a grim picture: St. Louis consistently ranks among the most dangerous cities in the U.S. for gun violence. Our data placed St. Louis at the top of the list for the highest number of gun-related injuries per 10,000 residents (18.6) as well as the highest incidence of gun-related deaths (9.1 per 10,000 people).
However, Ocala, Florida, is another city that has to be in the spotlight when it comes to firearm-related incidents. It had the highest volume of gun-related incidents, occurring at a rate of 28.9 per 10,000 residents.
Florida and gun violence remain closely linked in public discourse. The state has one of the highest rates of gun deaths in the Southeast, and its gun laws continue to generate national debate. In 2023, Florida enacted permitless carry legislation, allowing most adults 21 and older to carry a concealed firearm without a permit. The state previously made headlines after the 2018 Parkland school shooting, which prompted lawmakers to pass a bill allowing teachers to bring a gun in the classroom as a means of defense, requiring a 144-hour training program for any educator who chooses to be armed.
Besides Ocala, Florida, other major cities with a high volume of gun-related incidents are Detroit, Michigan, followed behind by St. Louis.
Gun Crime on the Rise
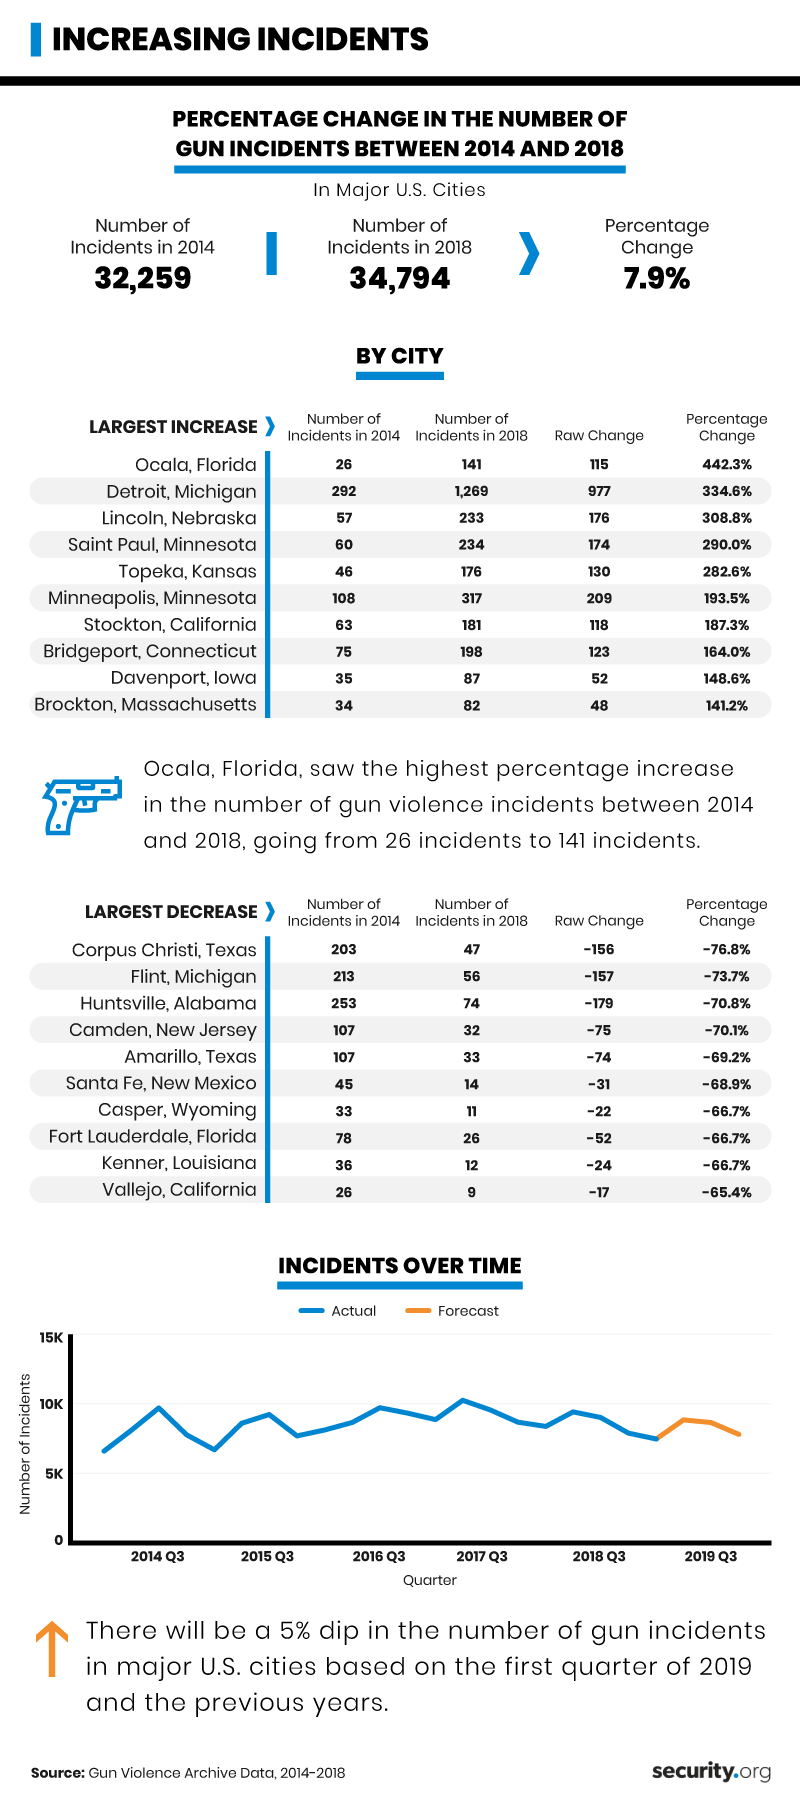
On a national scale, crime has been on a steady decline following its most recent peak in the 1990s: For example, the U.S. recorded just over 380 violent crime incidents per 100,000 residents in 2017, compared to nearly 750 in 1993. However, in major American cities, there was a 7.9% spike in gun incidents between 2014 and 2018. More recently, gun violence surged during the COVID-19 pandemic — the firearm homicide rate jumped about 35% between 2019 and 2020, according to the CDC.
Some areas felt this uptick much more than others. For example, Ocala experienced a 442% increase in gun crime, followed by Detroit at over 334% and Lincoln, Nebraska, at nearly 309%. And while some cities recorded a declining number of gun incidents – Corpus Christi, Texas, experienced the most marked decline at almost -77% – these numbers were no match for the crime spikes that occurred during the same time frame.
Where Gun Violence Happens
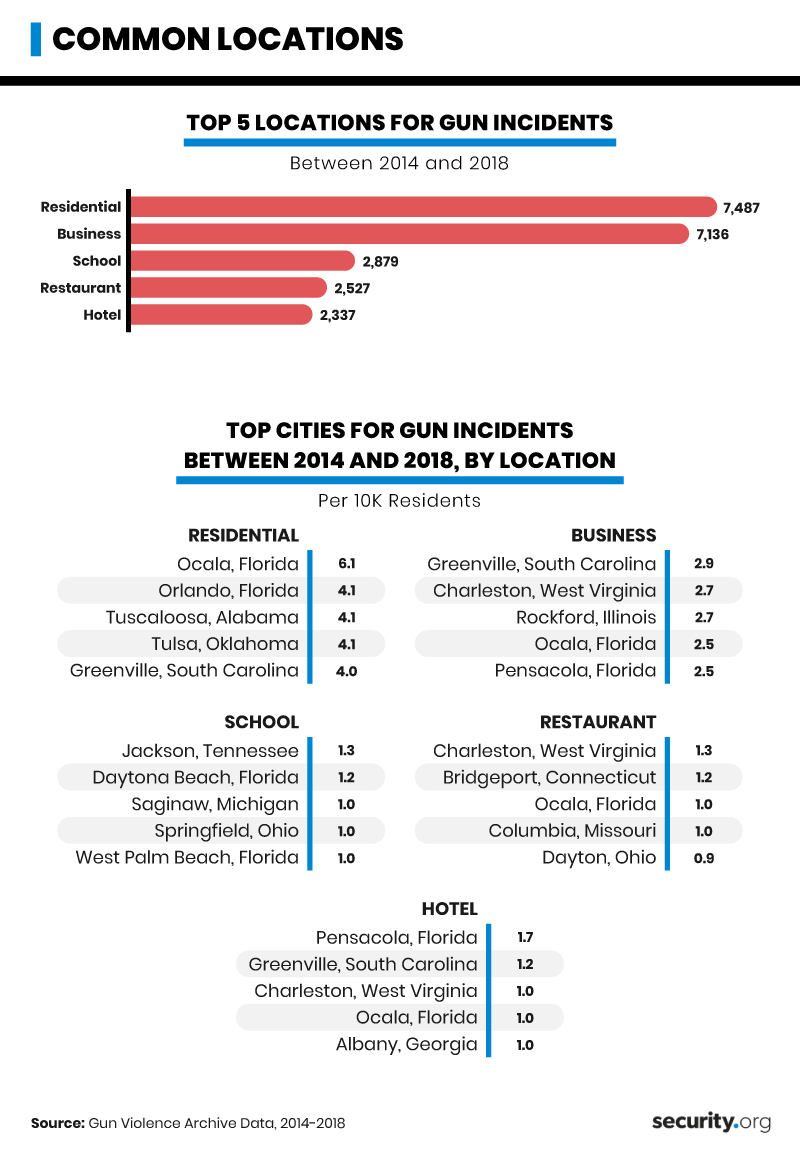
While firearm violence occurring in public (e.g., school shootings) is often what makes the news, the majority of gun incidents happen at private residences: 7,487 such incidents unfolded at someone’s home, followed by 7,136 that occurred at a place of business. Another 2,879 incidents took place at a school.
Residents in Ocala, Florida, experienced the highest number of residential gun incidents in the nation at 6.1 per 10,000 people. That’s nearly 49% more than Orlando, another Florida city, with 4.1 incidents on average. When the data was sliced by location of gun violence, no significant trend emerged: Each location, from schools to businesses, had a different city at the top of the list.
To reduce the risk of a firearm-related incident at home — especially with kids around — it’s critical to follow safe storage guidelines for guns. The basics: keep firearms locked, store ammunition separately, and make sure children can’t access either.
Locks, Stocks, and Barrels
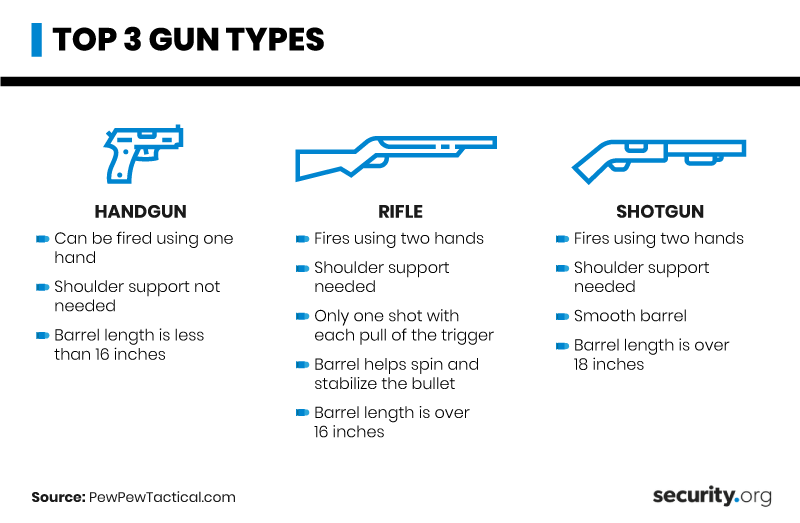
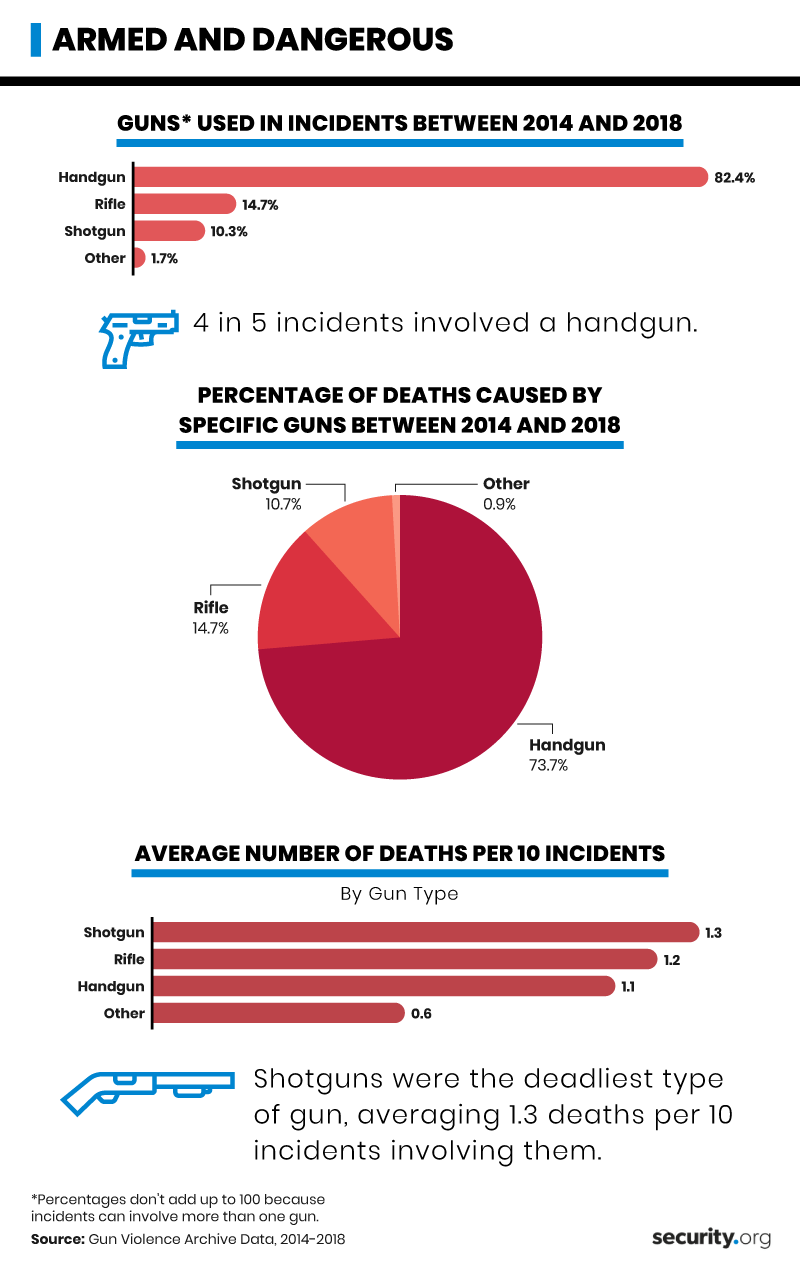
A handgun is among the few firearms that can be operated with one hand and requires no shoulder support. It is also the smallest. Given its more compact and, therefore, highly portable nature, it is unsurprising that over 82% of incidents involved this type of gun.
Handguns also accounted for nearly three-quarters of gun deaths during this period. However, shotguns caused the highest number of fatalities on average, with 1.3 deaths per 10 incidents.
Reducing the risk of fatalities – and accidents, in particular – starts with understanding how to use a firearm safely and responsibly. Always be sure to read up on best practices before handling or firing a gun, whether alone or in the presence of others.
Deadliest Dates
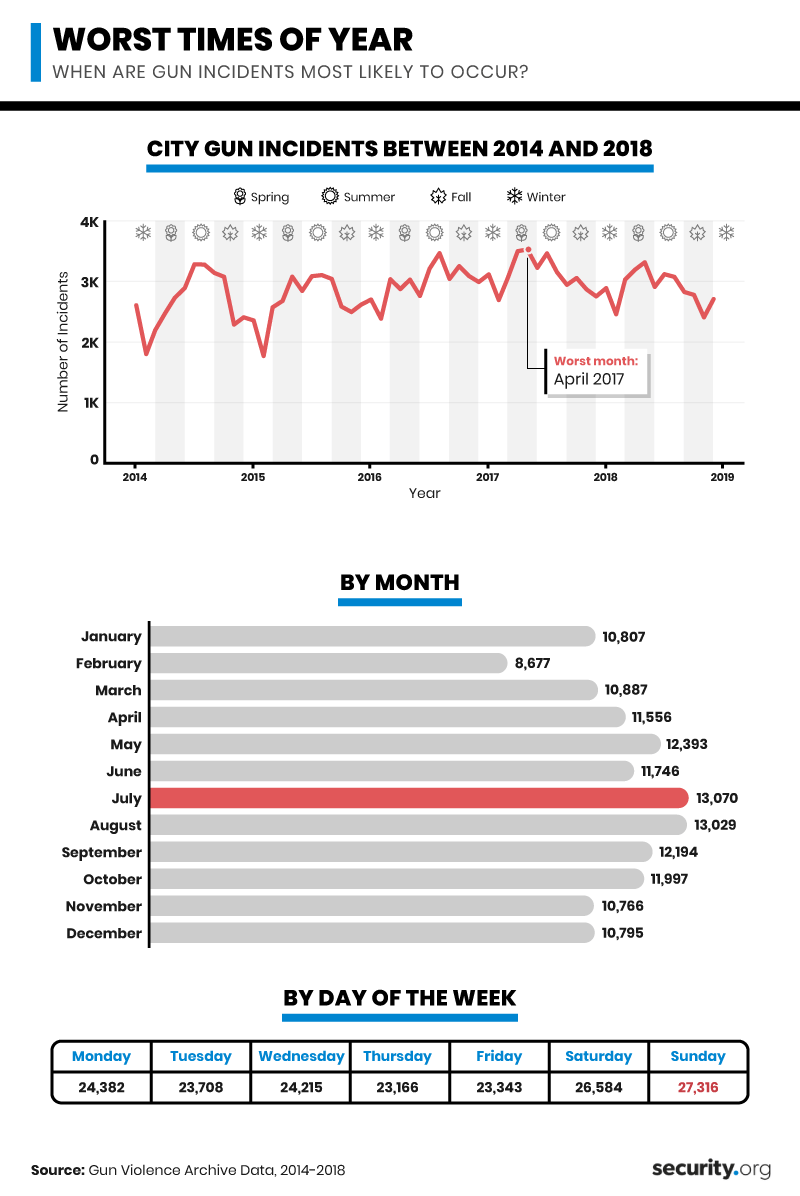
Warm weather and weekends proved to be a particularly fatal duo for gun violence in the U.S. Our data revealed that July was the most violent month of the year with an average of 13,070 firearm incidents occurring. August took an extremely close second with 13,029 average incidents. Sunday topped the list for the most violent day of the week, followed by Saturday.
This pattern holds up in more recent data, too. The Gun Violence Archive has consistently shown that the summer months of June, July, and August record the highest weekly incident totals of any period in the year. Major cities routinely brace for what officials call “summer violence season” — a period when heat, extended daylight hours, and increased outdoor activity converge to drive up firearm incidents.
Case in point: Recently, during the first warm weekend in Chicago, gun crime experienced a notable spike, with 24 shootings and five deaths recorded between Friday at 6 p.m. through Sunday. The mayor-elect had prepared for the “summer violence season.” That same weekend, Indianapolis experienced a rash of shootings – the city’s deadliest 24-hour period in five years.
Safety First
Ocala, Florida, was the city most affected by firearm incidents on the whole and experienced the largest increase in gun violence. While the average number of incidents rose across the country, areas like Ocala, Detroit, and other cities saw percentage increases in the hundreds.
Residences and businesses were the most frequent targets for firearm-related incidents, and handguns accounted for the lion’s share. July was found to be the most violent month across the U.S., and weekends experienced the highest rates of gun crime overall.
This pattern holds up in more recent data, too. The Gun Violence Archive has consistently shown that the summer months of June, July, and August record the highest weekly incident totals of any period in the year. Major cities routinely brace for what officials call “summer violence season” — a period when heat, extended daylight hours, and increased outdoor activity converge to drive up firearm incidents.
Methodology
Gun violence data originally come from the Gun Violence Archive. Data used for the study come from a dataset on Kaggle. You can review the methodology of the archive here.
Our definition of a major U.S. city is any city that had a population of at least 50,000 residents, according to the U.S. census.
For our chart “Percentage Change in the Number of Gun Incidents Between 2014 and 2018,” cities also had to have at least 26 incidents in 2014 to qualify. Cities that had zero incidents in 2018 were excluded.
Rates were calculated by dividing the total number of incidents/deaths/injuries by the population of that city and multiplying it by 10,000.
For gun type, the original data had the type of bullet involved in the incident. We grouped those bullets into the categories of guns that use them.
Fair Use Statement
Our study reinforces what we’re all thinking: Gun violence is on the rise and reminds us that something needs to happen. Something you can do is spread the word, like this article. All we ask is that it’s for noncommercial purposes and you link back to this page.