Homelessness in America:
Statistics, Analysis, and Trends
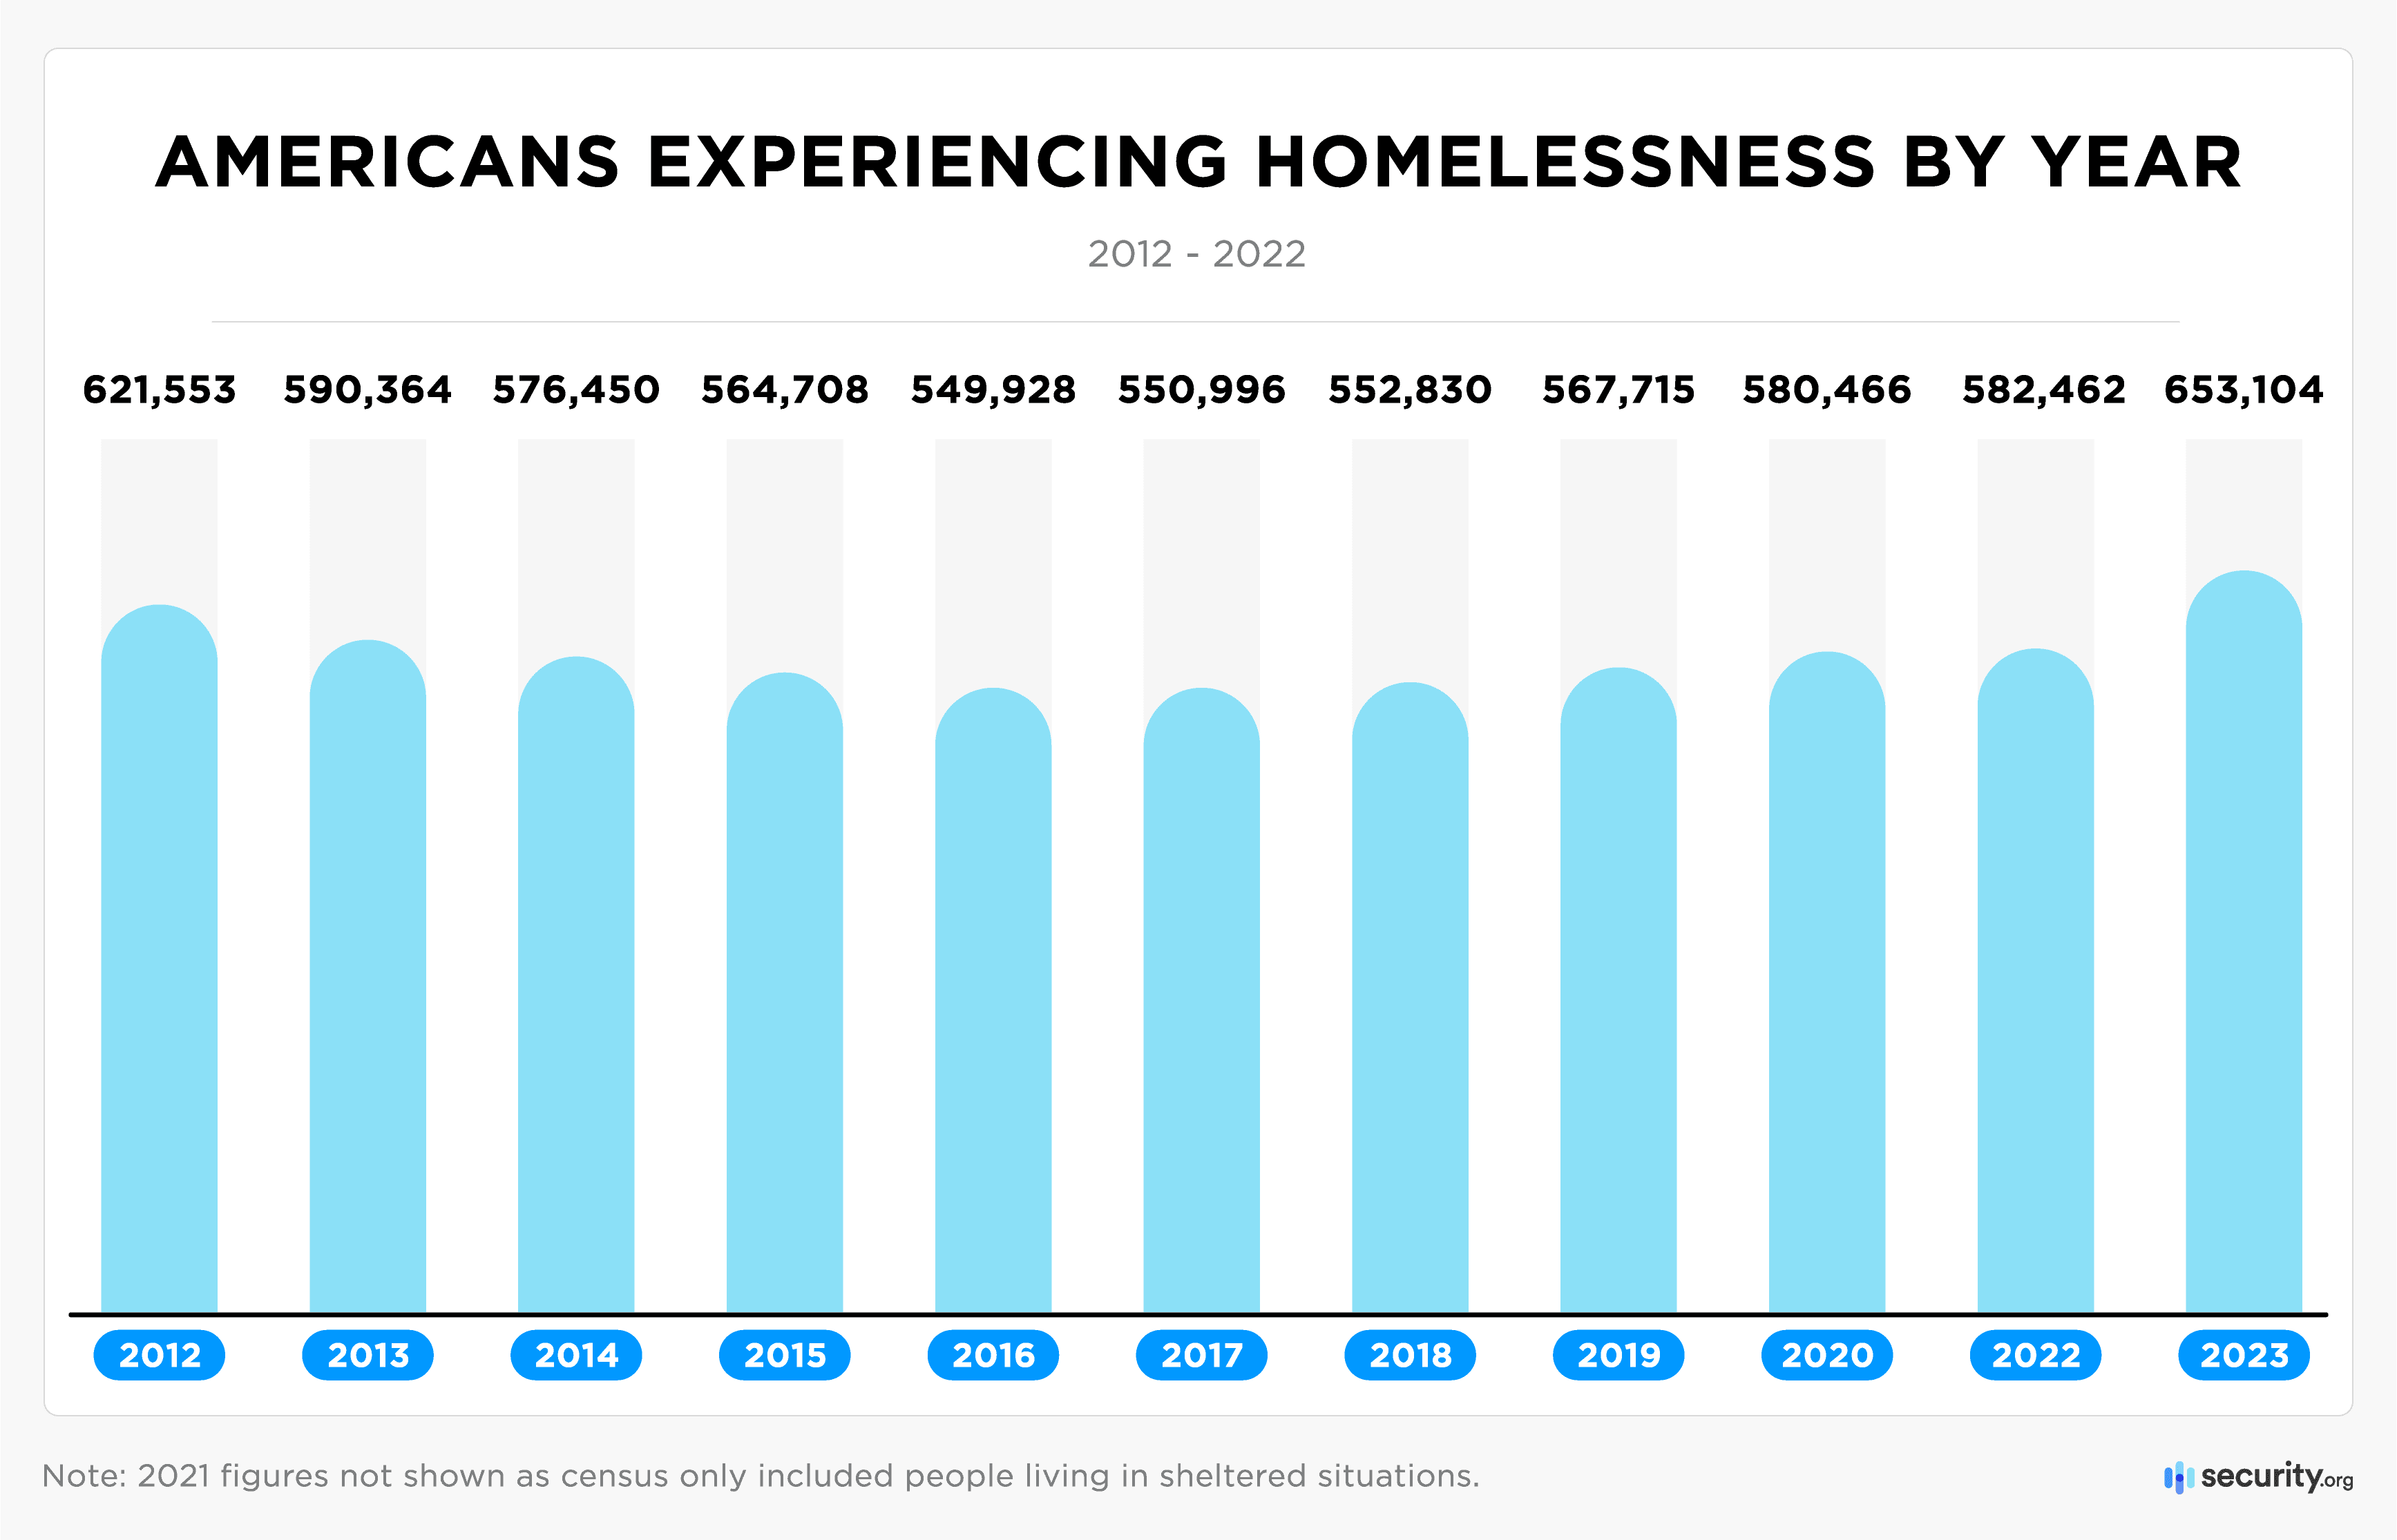
The Population of People Experiencing Homelessness Reached an All-Time High of Over 653,000 in 2023
Despite rising inflation rates, the U.S. economy is holding up impressively. As of the first quarter of 2024, unemployment is low and inflation – although still elevated – is slowing down. That doesn’t mean, however, that every American is doing well. One harsh indicator of that was the significant jump in homelessness over the past year.
According to the Department of Housing and Urban Development (HUD), a record number of people are currently unhoused in the U.S. Several factors are driving this increase, such as rising housing costs, surging immigration, and the end of many COVID-19 relief programs.
HUD’s 2023 Annual Homelessness Assessment Report (AHAR) found that more than 650,000 people in America lack permanent shelters. That represents the most documented homeless individuals since the inaugural report produced in 2007 and reflects a 12 percent increase over 2022.
Continuing Security.org’s commitment to highlighting housing insecurity, this report delves into the numbers to discern which communities suffered the most. This article is our 5th annual report on the issue.
Key Findings:
- 653,104 people experienced homelessness in the U.S. in 2023. That number represents a record-high tally and a 12 percent increase over 2022.
- 111,620 children were without homes in America last year.
- Homelessness increased in 41 states between 2022 and 2023, with New Hampshire, New Mexico, and New York having the highest percentage increases.
- New York, Vermont, and Oregon had the highest per-capita rates of homelessness in 2023.
- More than one-half of America’s homeless individuals reside in the nation’s 50 largest cities. New York City and Los Angeles alone contain one-quarter of the country’s unhoused people.
- Every ethnic group endured an increase in homelessness last year. The Asian community experienced the most significant percentage increase (64 percent), while Hispanics/Latinos saw the most significant surge in raw numbers (an additional 39,106 people).
American Homelessness in 2023: An Overview
HUD’s report, which came out in 2023, was based on a detailed report on homelessness that the department conducted earlier in the year. The 2023 AHAR reveals a grim truth – across the nation, 653,104 Americans were homeless. The agency describes homelessness as lacking a fixed, regular, and adequate nighttime residence.
Compared to the previous year, the number of homeless people in 2023 reflects a 70,642 increase. That’s equivalent to a 12-percent jump. The homelessness rate in 2023 is also the largest number the agency has seen throughout its 18-year history of taking surveys on homelessness. On top of that, homeless people in 2023 represented 0.19 percent of the national population that year – the highest rate since 2012.
Unfortunately, 2023 also marks the sixth consecutive year in which homelessness has grown, following a yearly decline between 2012 and 2015.
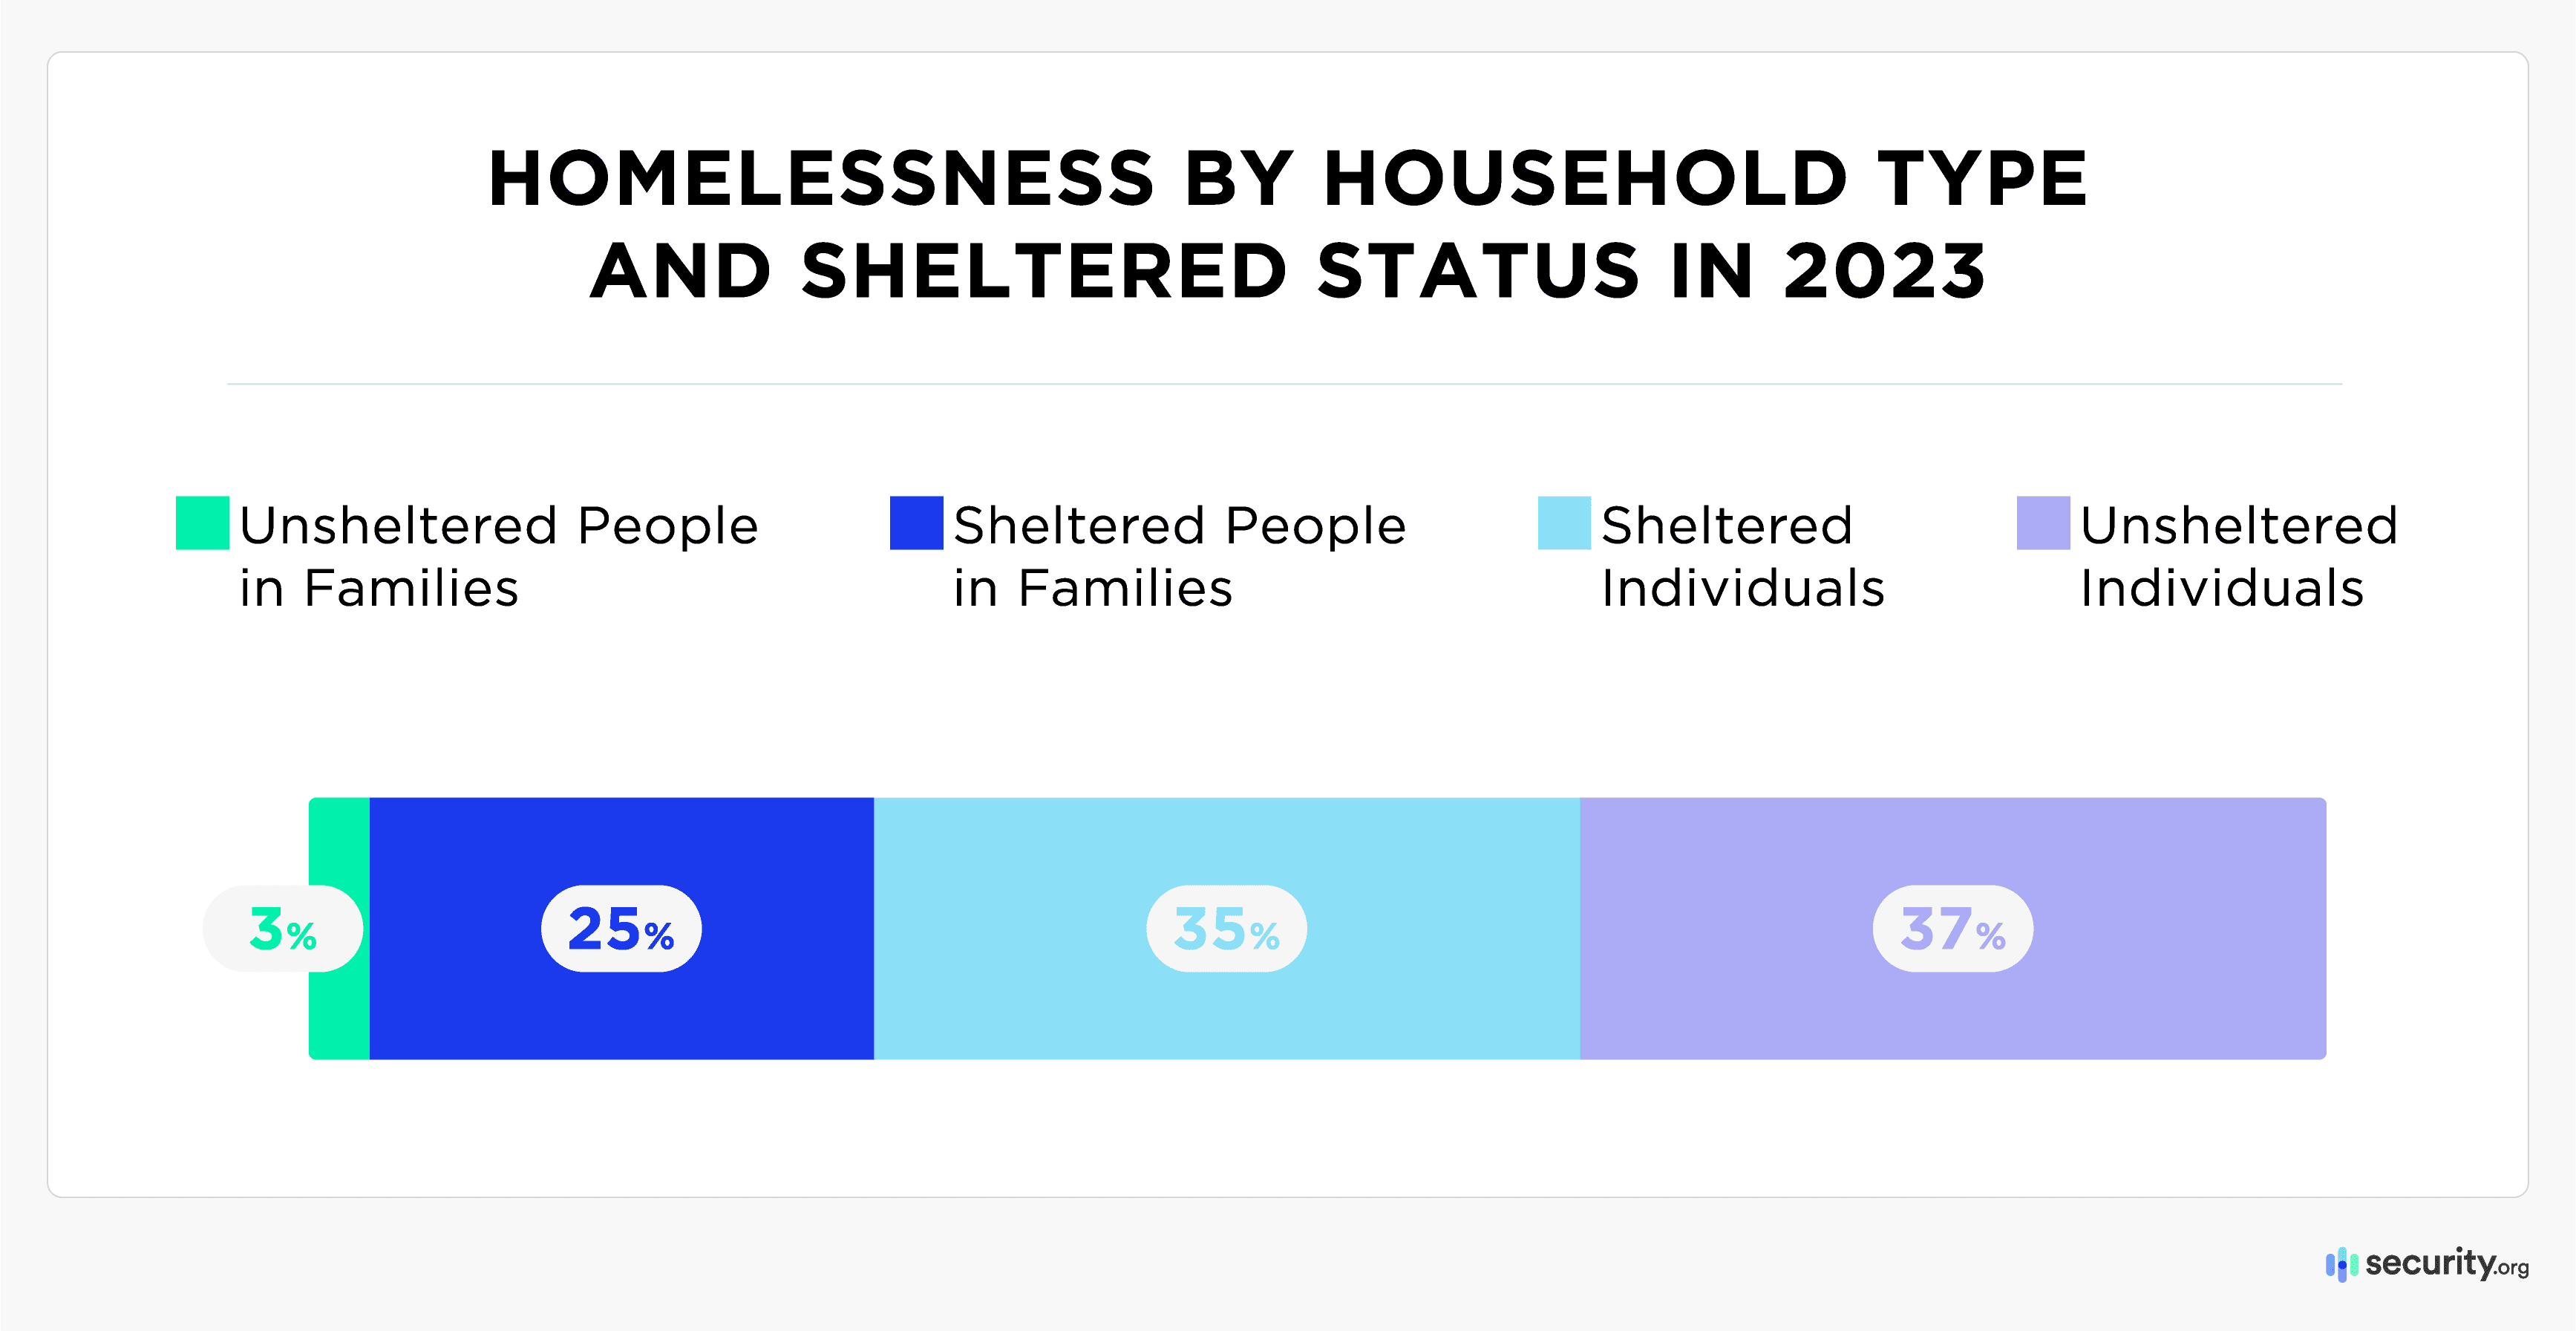
The share of homeless persons living in shelters remained roughly the same as in 2022. Six in ten individuals without housing (396,494 people) received temporary shelter via emergency facilities, transitional housing programs, or local safe-havens. The remaining 40 percent (256,610 people) slept in conditions deemed unfit for habitation, such as sidewalks, bus stations, empty buildings, or abandoned vehicles. Unsheltered homelessness rose for the seventh straight year.
Individuals experiencing homelessness on their own accounted for 72 percent of the total homeless population. Among them, only 49 percent live in shelters. The remaining 51 percent remain unsheltered.
Alarmingly, families experiencing homelessness increased in 2023 by 16 percent compared to 2022. These family units accounted for 186,084 individuals belonging to 57,563 family households. They account for nearly one-third of the total homeless population.
The silver lining – if we can call it that – is that most homeless families are sheltered. Of all the 57,563 families, 91 percent received temporary shelters.
Overall, unsheltered individuals comprised the most significant subset of people without housing, followed by sheltered individuals, sheltered family members, and unsheltered families.
No single cause has driven the troubling trend of increased American homelessness, though experts cite several prominent factors. An unequal financial recovery, a shortage of affordable housing, limited access to critical healthcare, the cessation of COVID-era aid programs, and an immigration influx all bear a share of the blame.
Notably, the national rise in homelessness has affected nearly every cross-section of society. The numbers have risen for all types of population centers and across genders, ethnicities, and age groups. As we detail below, some communities are more vulnerable than others.
Geographic Trends in Homelessness
Homelessness in America extends beyond harsh city streets or isolated regions; it impacts population centers of all shapes and sizes and extends from coast to coast.
State Rankings
Demonstrating the breadth of this endemic issue, the five states with the highest homeless rates range from the eastern seaboard (New York and Vermont) to the Pacific coastline (Oregon and California), out to the westernmost island (Hawaii).
Using this interactive map, you can explore the rates of homelessness per 100,000 residents for all 50 states and Washington, D.C.
California, New York, Florida, Washington, and Texas had the biggest overall homeless populations, and California and New York alone accounted for 44 percent of all Americans experiencing homelessness. Aside from being among the country’s most populous, these states share several traits that historically contribute to homelessness or attract people without homes. A high cost of living (as in New York, California, Washington, and Oregon) makes affordable housing scarce, while warm weather (Texas and Florida) can make states more appealing to those without secure housing.
| Largest Overall Homeless Populations | Highest Rates of Homelessness per 100,000 residents | Largest Percent Increase in Homeless Populations, 2022-2023 | |||
|---|---|---|---|---|---|
| California | 181,399 | New York | 527 | New Hampshire | 52% |
| New York | 103,200 | Vermont | 509 | New Mexico | 50% |
| Florida | 30,756 | Oregon | 476 | New York | 39% |
| Washington | 28,036 | California | 466 | Colorado | 39% |
| Texas | 27,377 | Hawaii | 434 | Montana | 37% |
On a per capita basis, the District of Columbia has the nation’s most pronounced homeless problem (725 people without homes per 100,000 citizens). Among states, New York posts the highest rate (527 per 100,000). Vermont had the second worst rate –- but its diminutive population (less than 650,000 inhabitants) can distort per capita ratings.
The homeless population increased in 41 states between 2022 and 2023, with New Hampshire recording the most dramatic escalation. The population of people experiencing homelessness there increased 52 percent year over year. In terms of raw numbers, New York’s unhoused population increased most, rising by nearly 30,000. This represents a 39 percent increase from 2022. State officials cited the end of the COVID eviction moratorium, high housing costs, improved counting methods, and an uptick in asylum seekers (many transported from Texas) to explain the startling upsurge.
Of the nine states with a decrease in homelessness in 2023, Louisiana (-57 percent) and Delaware (-47 percent) posted the most impressive declines. Louisiana attributed most of its improvement to re-housing residents displaced by 2021’s Hurricane Ida. Delaware’s one-year improvement was welcome, yet still left its unhoused population seven percent higher than pre-pandemic levels.
For a complete state-by-state list of homelessness numbers, see the data appendix following the article.
Population Centers for Homelessness
California and New York are particularly susceptible to housing issues due to their concentration of large urban centers. Nationwide, more than one-half of all people experiencing homelessness live in major cities.
Amazingly, nearly one-quarter of all of America’s unhoused individuals (24 percent) reside in New York City or Los Angeles alone. Seattle, San Diego, and Denver round out the five cities with the highest homeless populations, each with more than 10,000 unhoused residents.
| Cities with Most Individuals Experiencing Homelessness | |
|---|---|
| New York City | 88,025 |
| Los Angeles | 71,320 |
| Seattle | 14,149 |
| San Diego | 10,264 |
| Denver | 10,054 |
Though major cities saw the most remarkable spike in 2023 homelessness, the number of people without homes climbed in every type of setting – including a 10 percent jump in rural areas.
| Change in Number of People Experiencing Homelessness 2022-2023 By Community Setting | |
|---|---|
| Major cities | +17% |
| Largely urban | +8% |
| Largely suburban | +5% |
| Largely rural | +10% |
Population density is only one factor affecting housing status. Homelessness rates also vary widely by gender, age, and ethnicity – with a heightened impact felt by several specific communities.
Special Populations Experiencing Homelessness
No two tales of homelessness are identical, though many stories share certain elements. Some individuals leave the workforce or struggle with civilian life after military service. Many battle prejudices, substance abuse, or mental health issues. Some have never known life off the street, while others arrive penniless on promising new shores.
As we dissect national statistics, we must recognize that every number represents human suffering. We may uncover effective, targeted solutions by assessing the plights of narrower populations.
Children Without Homes in America
The 57,000 unhoused families have at least one child under the age of 18. In total, there are 111,620 homeless children in the U.S. Even more alarmingly, 10,548 of them are living outside shelters, and more than 3,000 are living on their own without guardians. While they represent a small percentage of the homeless population, it’s concerning to know that there are children without permanent shelter – one of their basic rights.
Beyond the children under 18, another 34,147 young adults aged 18-24 live alone and unhoused. Worse yet, most advocates warn that this number may be low – homeless children and youths are notoriously undercounted.
This resurgent crisis of underage homelessness threatens to undo a decade of steady progress. The number of people in families with minor children experiencing homelessness had dropped by one-third in the ten years leading to 2022. Last year, however, that total jumped 16 percent, growing by more than 25,000.
Massachusetts has the highest proportion of childhood homelessness: 39 percent of its unhoused population is under age 18. Other states with serious problems include Maine (29 percent), Minnesota and New York (28 percent each), and Delaware (27 percent). Setting better examples are Wyoming and Nevada, where children comprise less than 10 percent of their unhoused populations.
Ethnic Disparities: Race and Homelessness in America
As a nation of immigrants, America is a great melting pot but still struggles with economic equality. Despite recent gains by communities of color, there remains a wide wealth gap across racial divides – particularly for Black communities and Hispanic/Latin groups.
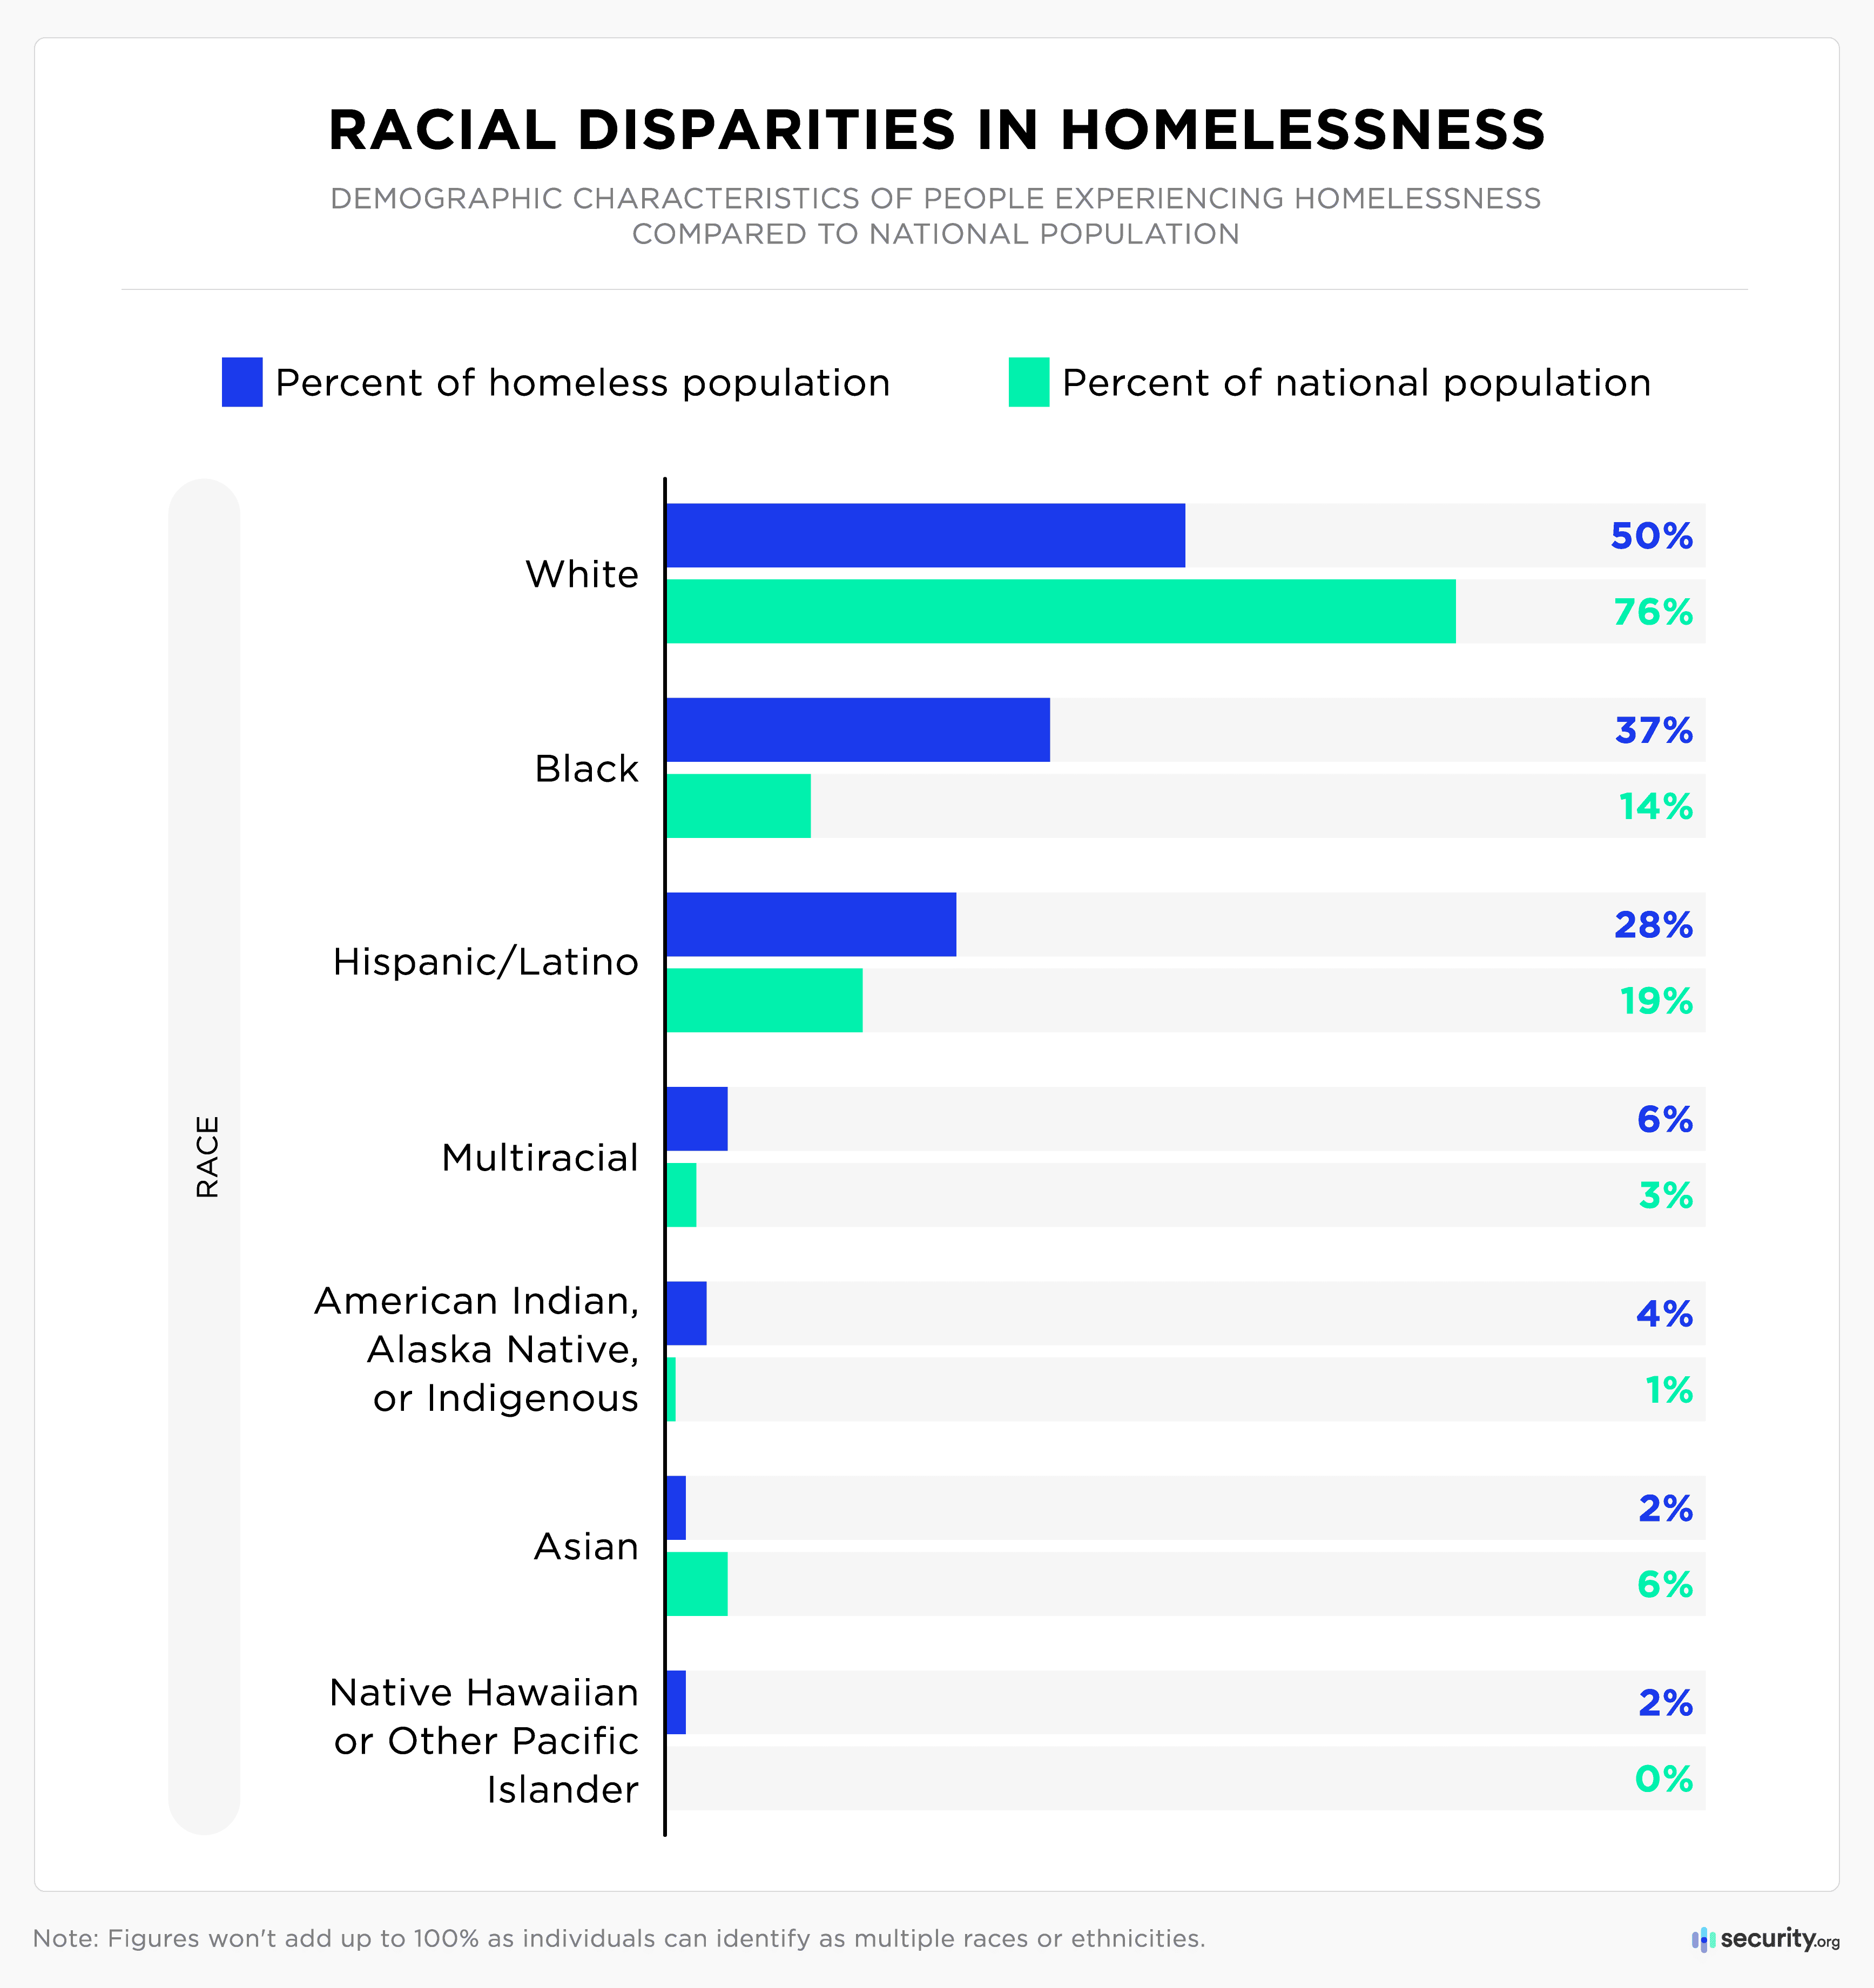
These disparities show through in the latest homeless numbers, which reveal that nearly two-thirds of the nation’s unhoused individuals are Black or Hispanic/Latino, despite these groups comprising only one-third of the country’s population.
The Black community experiences homelessness most disproportionately, at a rate nearly triple its population share.
From 2020-2022, the number of unhoused Black individuals dropped by 5 percent. Unfortunately, it jumped again in the past year, along with most other self-identified ethnic groups.
| Race | 2023 overall homeless population | Percent change 2022-2023 |
|---|---|---|
| Asian | 11,574 | 64% |
| Hispanic/Latino | 179,336 | 28% |
| American Indian, Alaska Native, or Indigenous | 23,116 | 18% |
| Black | 243,624 | 14% |
| White | 324,854 | 11% |
The Asian community endured 2023’s most considerable homelessness escalation by percentage, primarily because their previous numbers were consistently low – the total increase over 2022 was 60 percent but comprised only 3,313 additional people.
Hispanics registered the most considerable raw uptick of homelessness last year: the 2023 AHAR noted 39,106 more unhoused Hispanic/Latino individuals than in 2022. With 86 percent of this influx sheltered in temporary facilities, officials believe this increase is influenced by immigrants and asylum seekers who arrived from Central and South America.
Fallen Soldiers: Homeless American Veterans
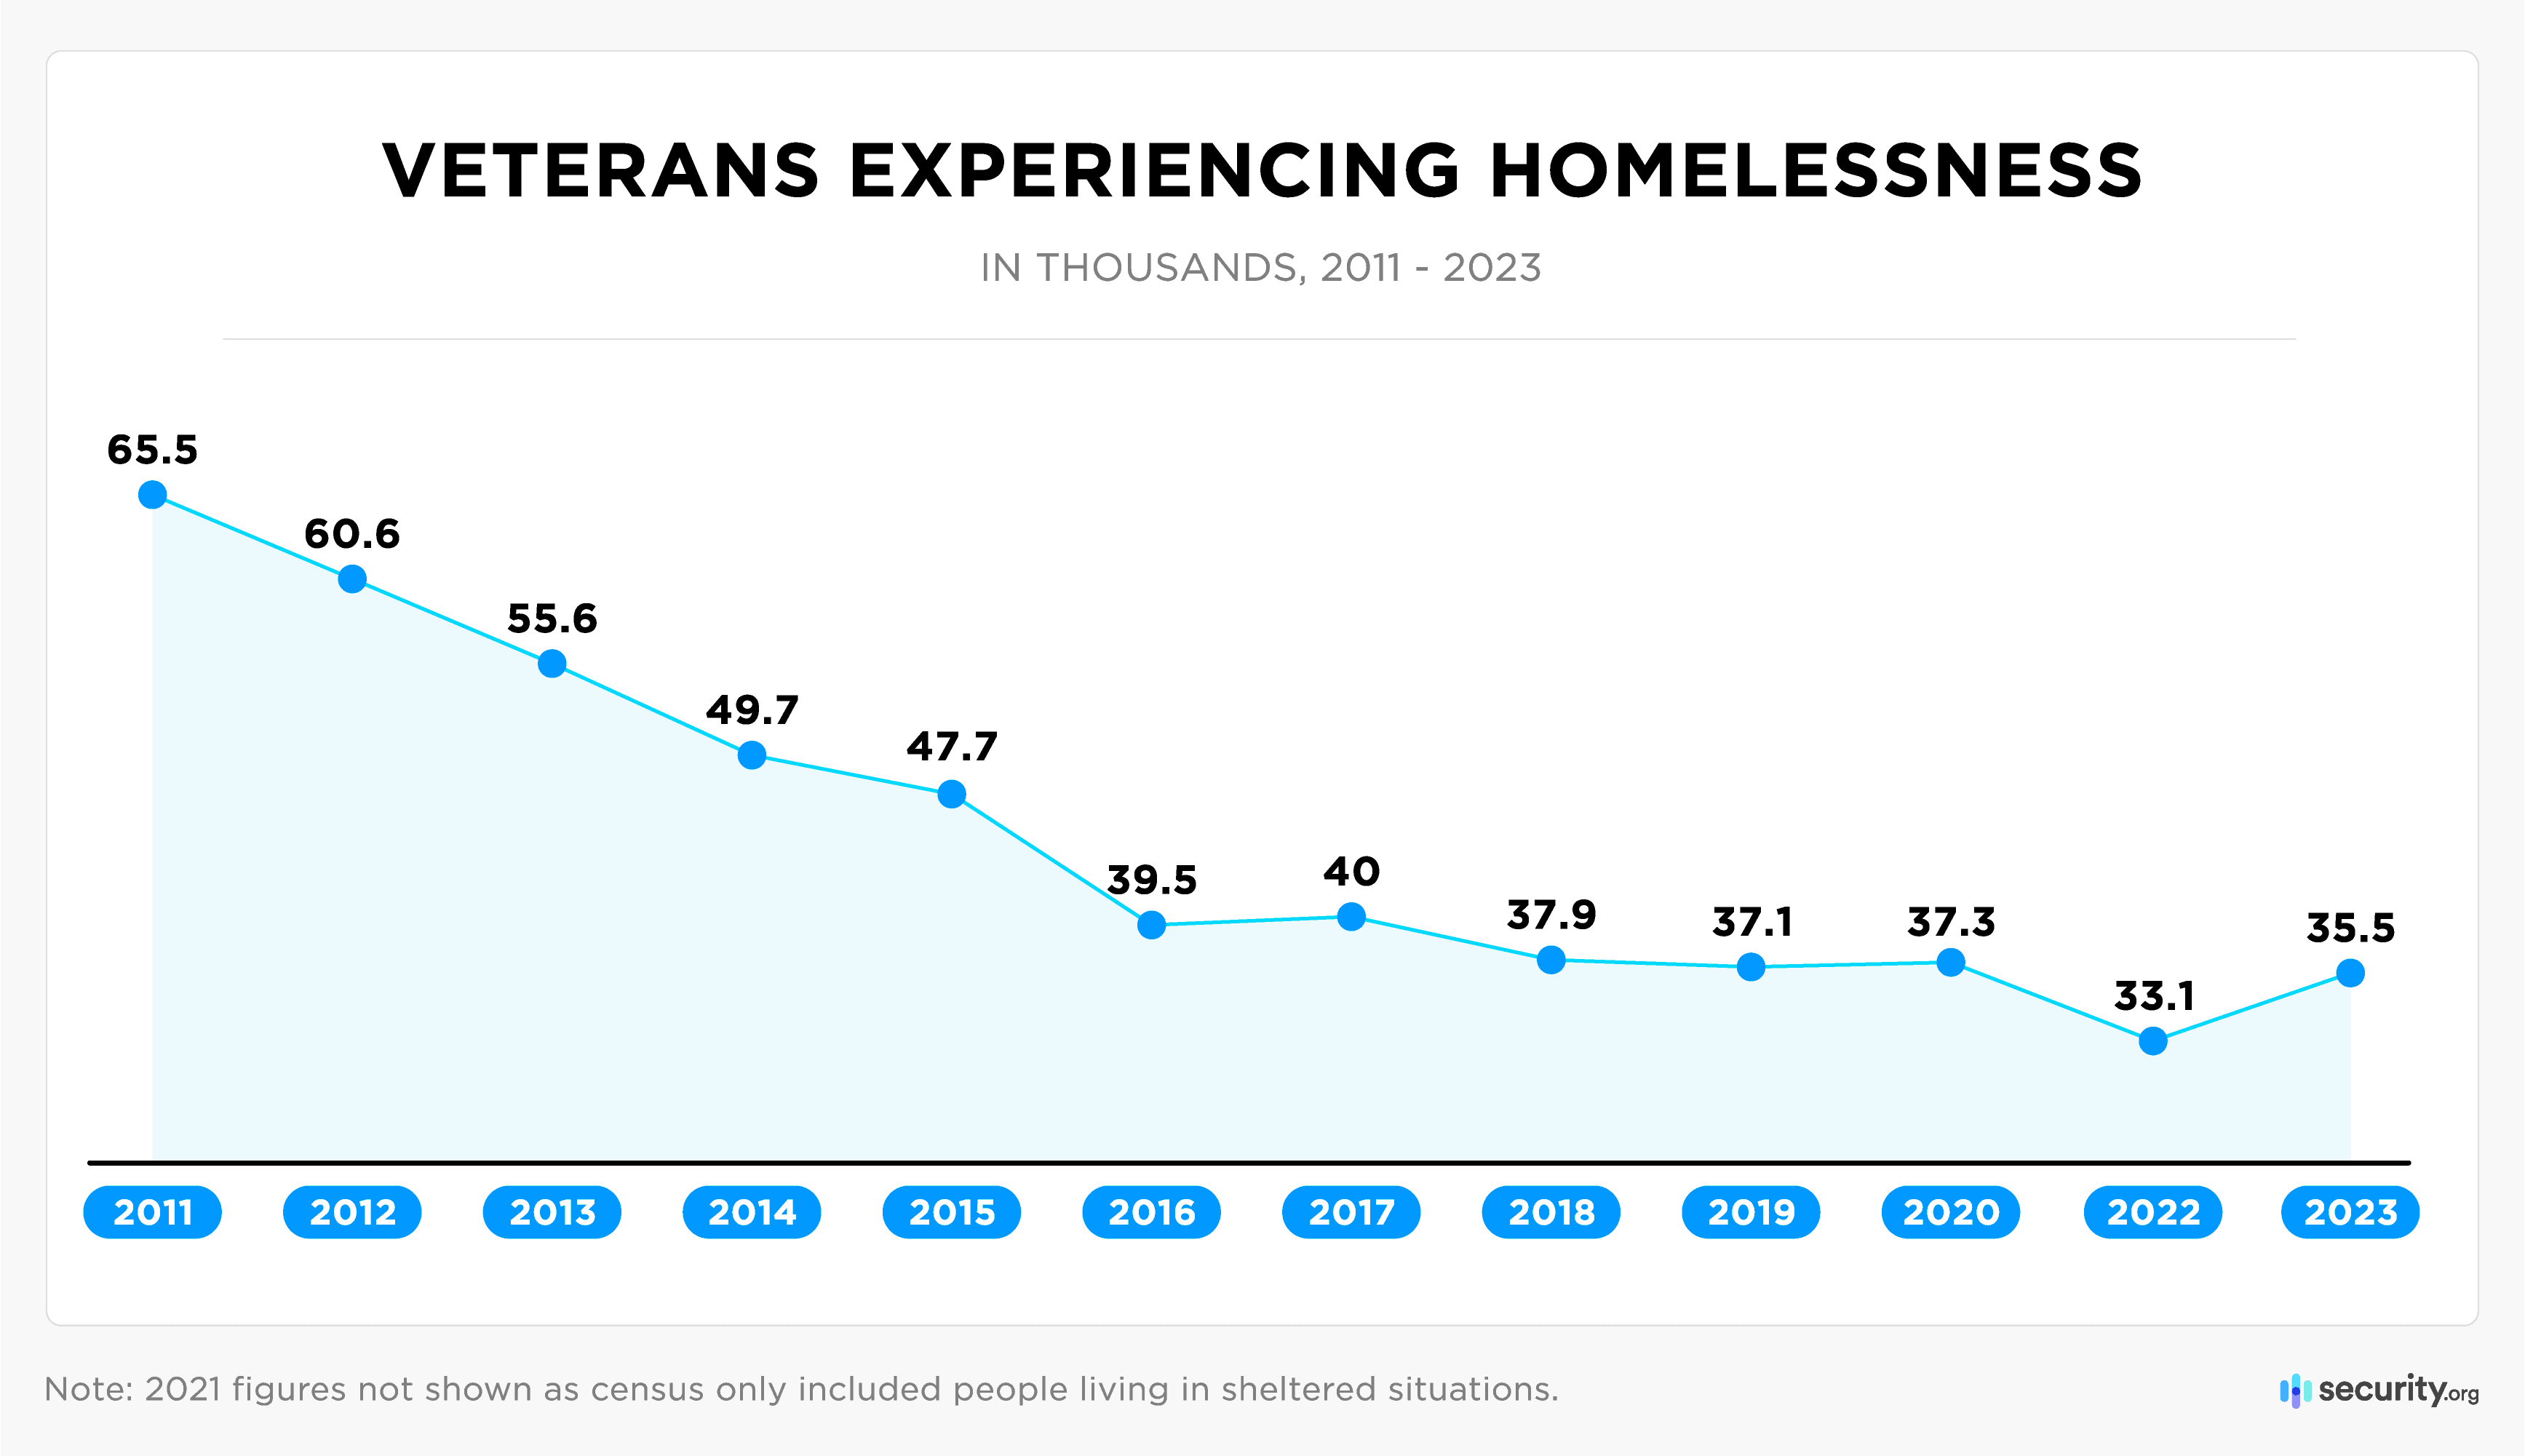
2023’s homelessness surge even affected veterans – a segment that had seen steady improvement over the previous decade.
At the outset of the Obama administration, homelessness among veterans was a shameful and chronic blight. HUD first tracked veteran homelessness in 2009, finding that ex-servicepeople experienced homelessness at twice the national rate, with more than 75,000 living without homes.
A concentrated effort that included billions in spending and an array of outreach programs became a blueprint for success, reducing the number of unhoused veterans by more than half between 2011 and 2022. That progress was interrupted last year. 2023 brought the most significant increase in veteran homelessness since HUD began tracking the situation; 2,445 additional individuals joined the ranks of the unhoused.
Even so, efforts of the Department of Veterans Affairs seem to have softened the blow; homelessness was up 12 percent nationally but only increased by seven percent among veterans. However, the number of unhoused veterans more than doubled in New Mexico and Arkansas in 2023.
| States with the largest percentage of people in homelessness who are veterans | States with greatest increase in rates of veterans experiencing homelessness (2022-2023) | ||
|---|---|---|---|
| Wyoming | 17% | New Mexico | 181% |
| Nevada | 13% | Arizona | 123% |
| South Carolina | 10% | Nevada | 45% |
| Montana | 10% | South Dakota | 45% |
| Alabama | 9% | Colorado | 38% |
Wyoming and Nevada – the two states with the lowest levels of child homelessness – registered the highest percentage of veterans among their unhoused population. They might look to New York for answers, as that state has cut its homeless veteran numbers by more than 80 percent since 2009, and now only one percent of its unhoused population are veterans.
Chronic Homelessness: Expanding Desperation
The most insidious aspect of the nation’s housing crisis is chronic homelessness – defined as individuals with disabilities who have been homeless for more than 12 months or have experienced several periods of extended homelessness over the past three years.
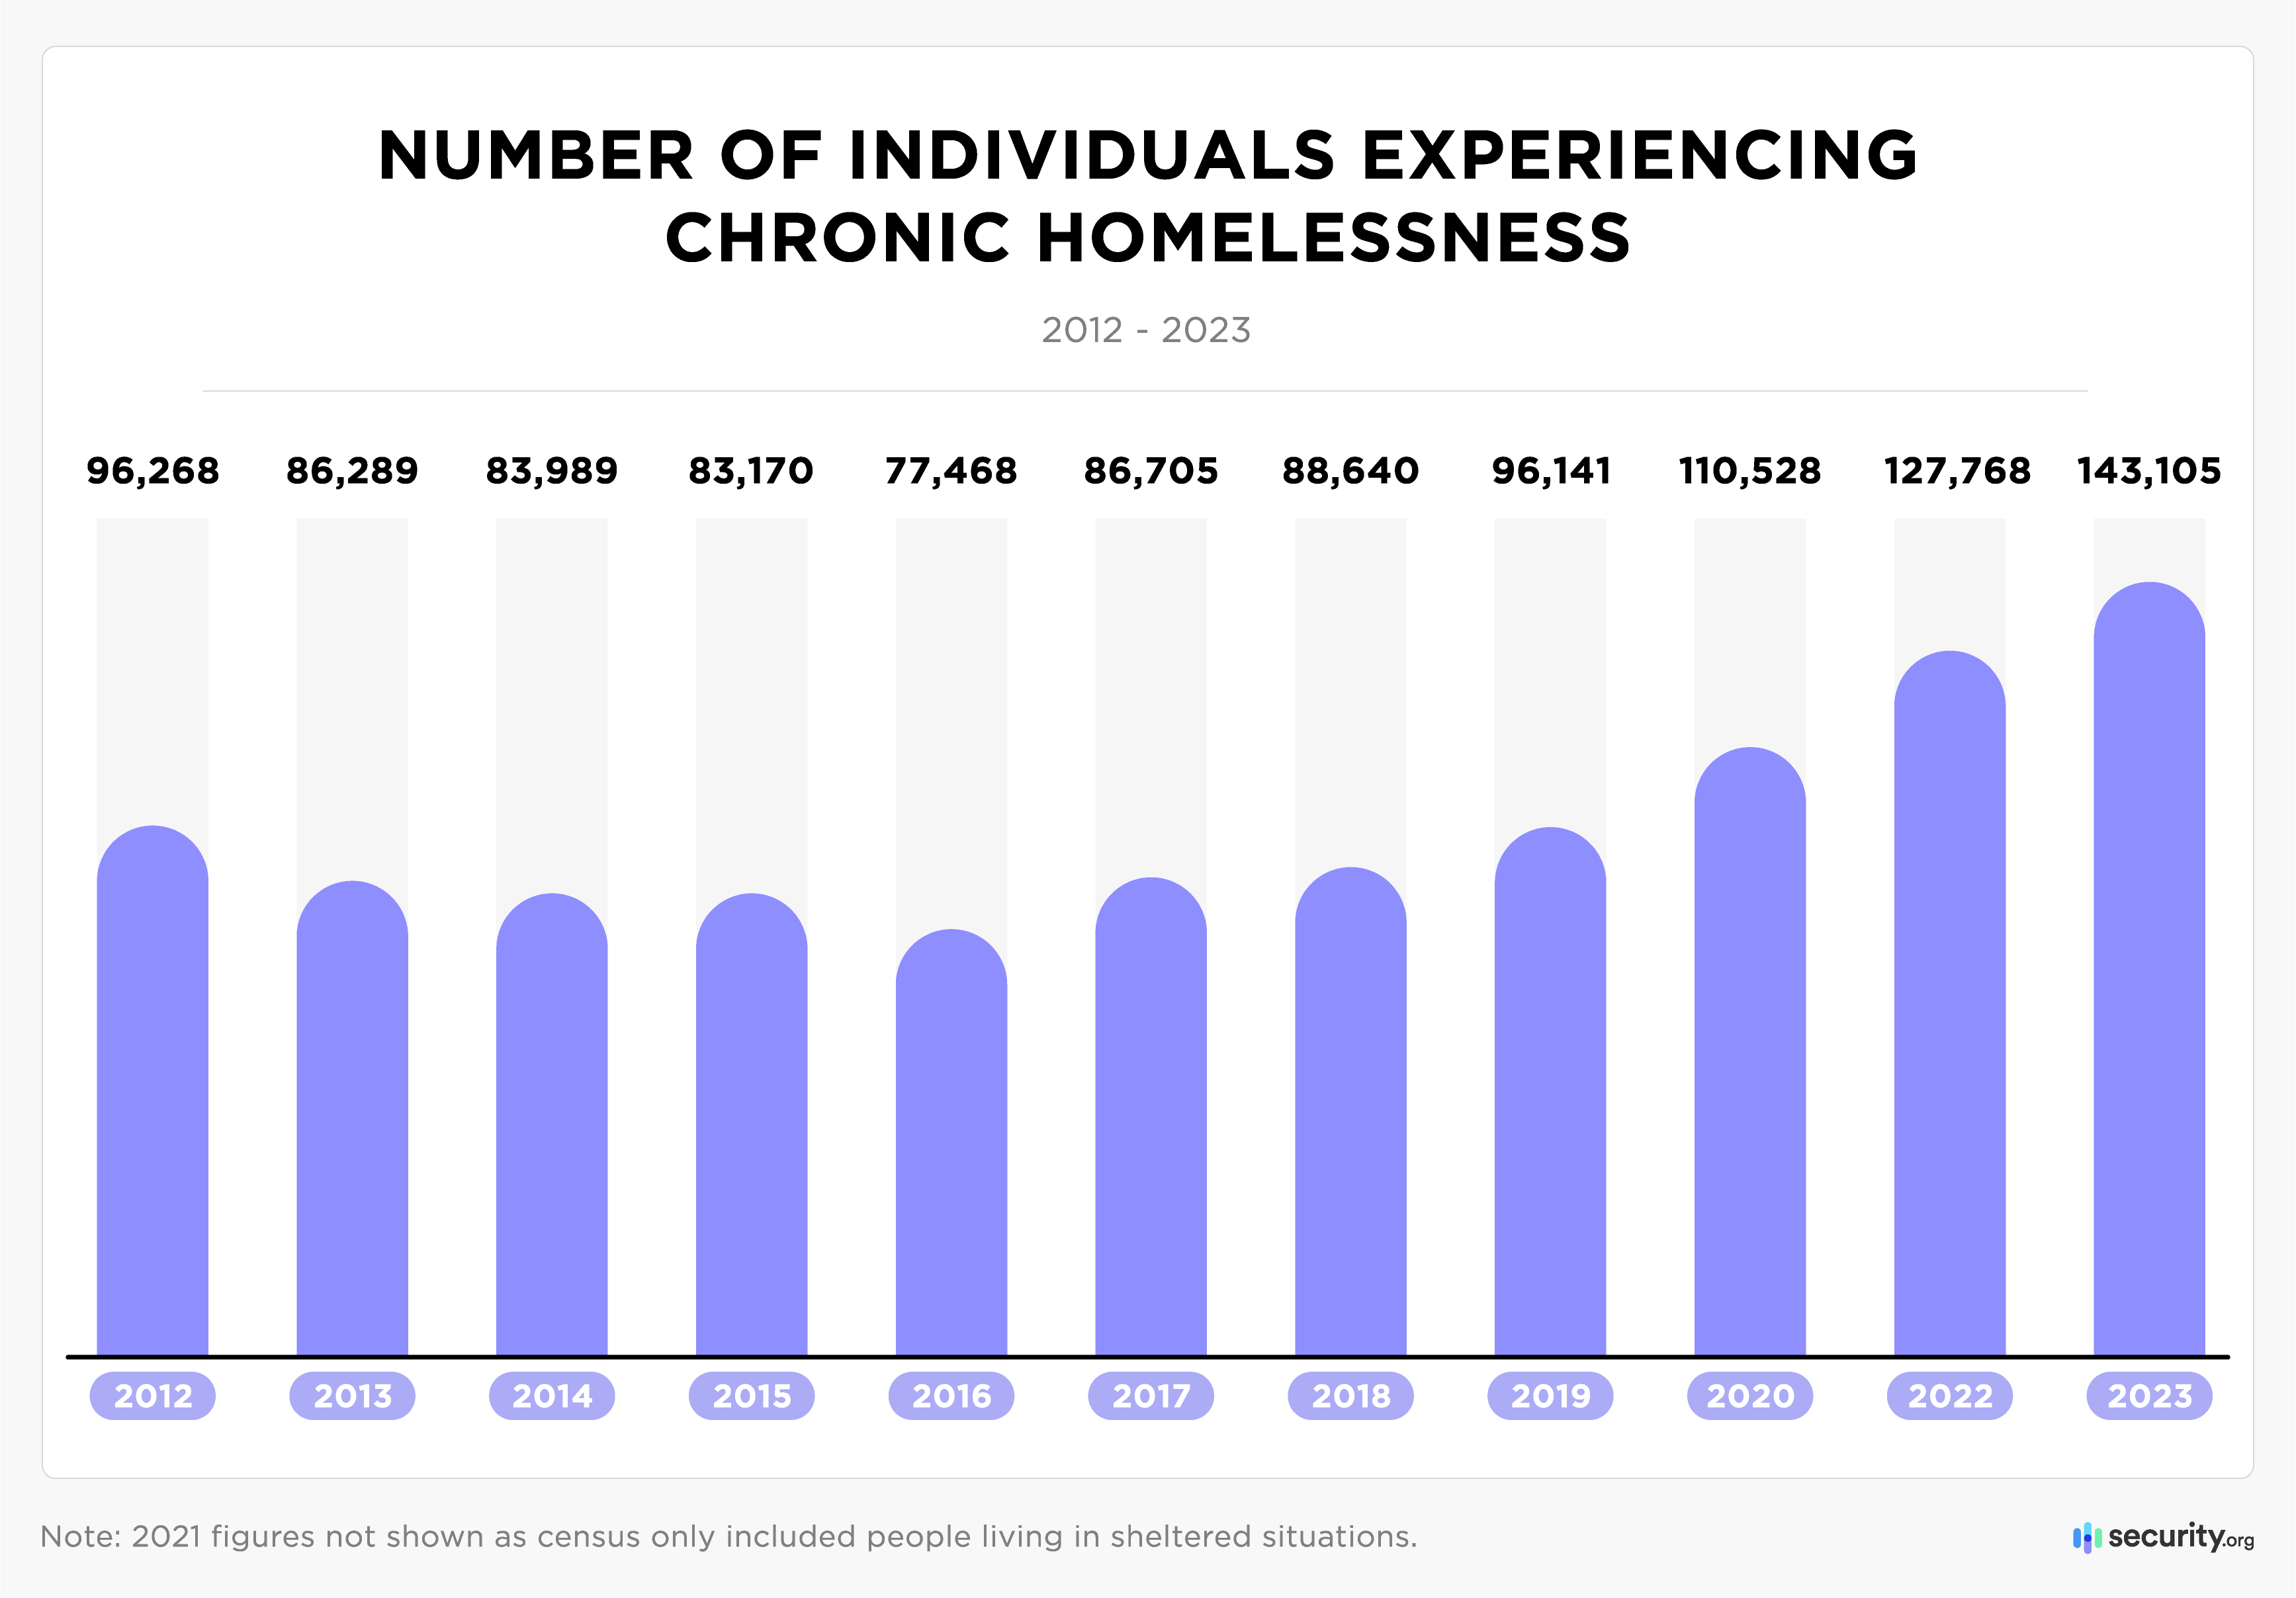
In 2023, nearly one-third of all unhoused individuals (31 percent) exhibited chronic patterns of homelessness – the highest proportion since record-keeping began. The number of chronically unhoused individuals has increased annually since 2016, nearly doubling during that span.
The worsening problem is particularly pervasive in western states: California, Washington, Oregon, Nevada, and Hawaii experienced the most significant increases in chronic homelessness since 2007. California alone contains nearly one-half of the nation’s chronically unhoused (47 percent, or 67,510 individuals). Los Angeles is home to more than 30,000 individuals experiencing chronic homelessness – more than six times more than the next most afflicted city (New York, with just over 4,500).
| States with the largest percentage of individuals experiencing chronic homelessness in 2023 | |
|---|---|
| New Mexico | 50% |
| Rhode Island | 48% |
| California | 43% |
| Oregon | 39% |
| Colorado | 37% |
Factors Influencing Homelessness in 2024
The homelessness crisis in America has numerous causes, ranging from systemic economic inequalities to the recent end of COVID-era assistance. While progress has been made, 2023 was filled with setbacks. Analyzing the recent surge, experts identified several key contributors:
- Economic disparities: The unequal distribution of wealth worsened during the post-COVID recovery, impacting income and exacerbating homelessness risk. Despite a thriving economy, rising inflation eroded buying power for the working classes and further burdened those on the margins most at risk of becoming unhoused..
- Housing affordability: Skyrocketing housing costs, rents, and mortgage rates make homeownership unattainable for many. The resulting housing competition leaves numerous Americans without shelter.
- End of COVID-era assistance: Stimulus packages and protective programs that aided struggling Americans during the pandemic expired in 2023, contributing to worsening living conditions and increased homelessness.
- Immigration surge: As Congress remains unable to pass immigration reform, record numbers of hopeful migrants and asylum seekers continue to cross America’s southern border. This influx strains resources in major cities.
- Limited healthcare access: Many of those experiencing chronic homelessness are trapped in cycles of poverty connected to substance abuse or other mental health issues. A broken healthcare system burdened with high prices, restrictive insurance coverage, and limited available resources makes accessing mental health care difficult in America. California and New York are experimenting with programs that include compulsory treatment for mental health issues among those seeking government assistance.
Targeted approaches like increasing funding for people with housing insecurities or launching local pilot programs in cities like Houston and Dallas can help dent the problem. However, until these more prominent systemic factors are addressed, true housing security will remain elusive.
Conclusion
The issue of homelessness has long plagued America as an embarrassing shortcoming in our land of plenty. Government initiatives and charitable efforts have progressed in the ongoing battle – particularly among specific societal cross-sections. Still, hundreds of thousands have remained without permanent shelter.
The end of pandemic economic assistance, alongside rising inflation, unaffordable housing costs, and a massive immigration inflow, all contributed to hardships that left more than 650,000 individuals across all demographics unhoused in our nation, nearly one-third of them chronically. This is the largest number of unhoused Americans in history.
Whether this upturn is a brief aberration or a sign of darker times ahead will depend on the economy, the upcoming election, and the efficacy of experimental approaches. Next year’s AHAR will help paint the picture, and Security.org will stand ready to break down the numbers.
Methodology
All figures on homelessness in this report come from the U.S. Department of Housing and Urban Development’s Annual Homelessness Assessment Reports to Congress, with the latest statistics derived from its 2023 Point in Time homelessness count. The table below does not include U.S. territories, which are included in the HUD report and national totals. You can access the tables and HUD’s latest report to Congress here. Demographic information regarding the general population came from publicly available figures from the U.S. Census Bureau 2023 population estimates.
Data Appendix
| State | Total homeless population (2023) | Percent change in population since 2022 | Percent of people experiencing homelessness who are under 18 (2023) | Percent who are veterans (2023) | Percent of individuals experiencing chronic homelessness (2023) |
|---|---|---|---|---|---|
| Alaska | 2,614 | 13% | 14% | 5% | 30% |
| Alabama | 3,304 | -12% | 17% | 9% | 22% |
| Arkansas | 2,609 | 6% | 12% | 8% | 34% |
| Arizona | 14,237 | 5% | 11% | 7% | 22% |
| California | 181,399 | 6% | 9% | 6% | 39% |
| Colorado | 14,439 | 39% | 16% | 7% | 31% |
| Connecticut | 3,015 | 3% | 19% | 5% | 4% |
| District of Columbia | 4,922 | 12% | 15% | 4% | 28% |
| Delaware | 1,245 | -47% | 27% | 6% | 14% |
| Florida | 30,756 | 18% | 16% | 8% | 19% |
| Georgia | 12,294 | 15% | 19% | 6% | 14% |
| Hawaii | 6,223 | 4% | 15% | 5% | 26% |
| Iowa | 2,653 | 10% | 19% | 5% | 20% |
| Idaho | 2,298 | 15% | 20% | 8% | 18% |
| Illinois | 11,947 | 30% | 20% | 4% | 12% |
| Indiana | 6,017 | 10% | 20% | 8% | 12% |
| Kansas | 2,636 | 10% | 17% | 8% | 18% |
| Kentucky | 4,766 | 20% | 12% | 9% | 20% |
| Louisiana | 3,169 | -57% | 12% | 8% | 14% |
| Massachusetts | 19,141 | 23% | 39% | 3% | 14% |
| Maryland | 5,865 | 10% | 20% | 5% | 18% |
| Maine | 4,258 | -3% | 29% | 3% | 9% |
| Michigan | 8,997 | 10% | 25% | 5% | 13% |
| Minnesota | 8,393 | 6% | 28% | 4% | 24% |
| Missouri | 6,708 | 12% | 18% | 8% | 24% |
| Mississippi | 982 | -18% | 13% | 6% | 13% |
| Montana | 2,178 | 37% | 14% | 10% | 26% |
| North Carolina | 9,754 | 4% | 17% | 8% | 17% |
| North Dakota | 784 | 29% | 17% | 3% | 22% |
| Nebraska | 2,462 | 10% | 17% | 5% | 25% |
| New Hampshire | 2,441 | 52% | 18% | 4% | 22% |
| New Jersey | 10,264 | 17% | 24% | 4% | 19% |
| New Mexico | 3,842 | 50% | 18% | 7% | 44% |
| Nevada | 8,666 | 14% | 8% | 13% | 28% |
| New York | 103,200 | 39% | 28% | 1% | 6% |
| Ohio | 11,386 | 7% | 18% | 5% | 11% |
| Oklahoma | 4,648 | 24% | 13% | 6% | 30% |
| Oregon | 20,142 | 12% | 13% | 8% | 34% |
| Pennsylvania | 12,556 | -1% | 21% | 7% | 16% |
| Rhode Island | 1,810 | 15% | 21% | 6% | 35% |
| South Carolina | 4,053 | 12% | 13% | 10% | 21% |
| South Dakota | 1,282 | -8% | 16% | 5% | 18% |
| Tennessee | 9,215 | -13% | 11% | 8% | 22% |
| Texas | 27,377 | 12% | 15% | 7% | 18% |
| Utah | 3,687 | 4% | 16% | 5% | 27% |
| Virginia | 6,761 | 4% | 23% | 6% | 16% |
| Vermont | 3,295 | 19% | 20% | 4% | 8% |
| Washington | 28,036 | 11% | 16% | 6% | 31% |
| Wisconsin | 4,861 | 2% | 24% | 7% | 12% |
| West Virginia | 1,416 | 3% | 9% | 6% | 18% |
| Wyoming | 532 | -18% | 7% | 17% | 14% |


