Which Americans Are at Highest Risk of Robberies?
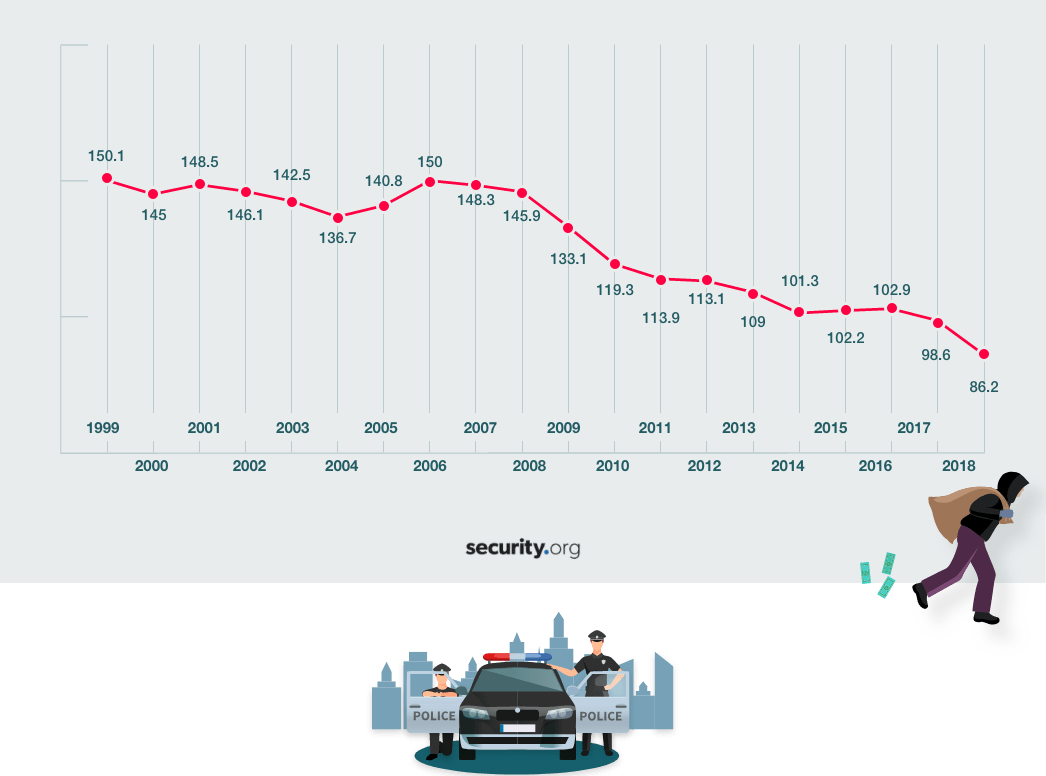
Like most crimes in the United States, robbery rates have fallen dramatically over the past two decades. In fact, FBI data shows that reported robberies declined year-after-year in 14 of the past 20 years. Over that two-decade span, robbery rates have dropped by more than 42.6%.
In just the past 10 years, the robbery rate is down by more than one-third, which is the second- largest decline among all reported crime rates, behind only the 47.6% decline in the burglary rate between 2009 and 2018.
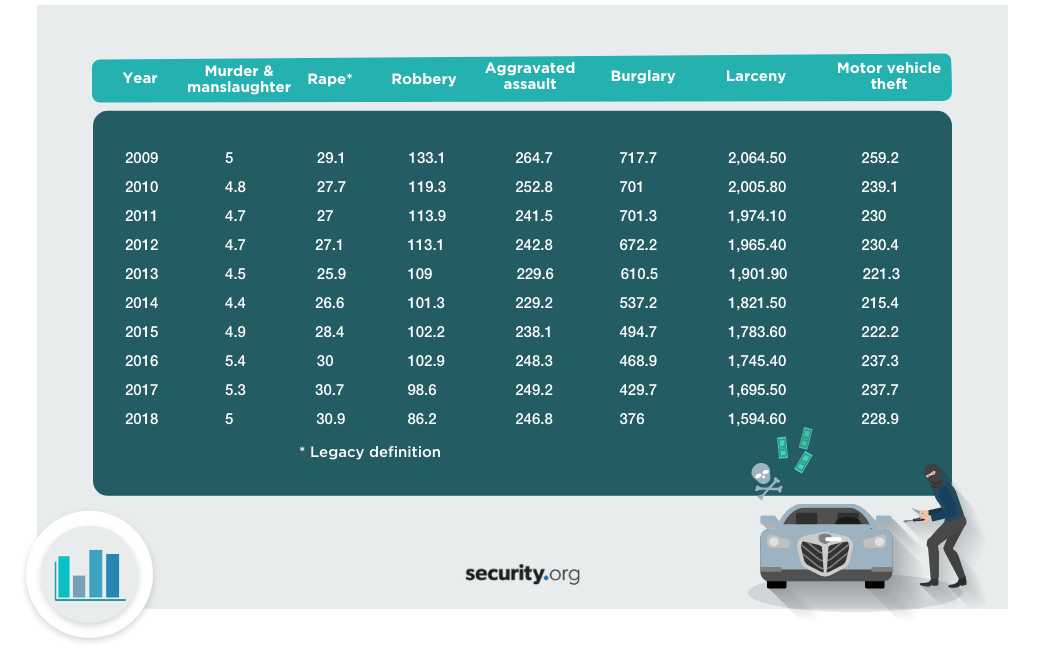
Most crime rates have fallen over the past decade, with the exception of the rate of rapes (+6.2%) and the rate of murders and manslaughters (no change). Robbery has fallen by 35.2%, aggravated assault is down 6.8%, larceny theft has fallen by 22.8%, and motor vehicle theft has decreased by 11.7%. Each of these crimes has seen its rate fall over the past 20 years, led by a 51.2% decline in burglaries.
The declining robbery rates, however, are no reason to get comfortable. Robbery is still the second-most common type of violent crime, next only to aggravated assault. Robber impacts Americans at a population-adjusted rate of 86.2 per 100,000, which is still a concerning number.
On top of that, robbery tends to cost its victims more than larceny theft, which is the most common crime in the U.S. According to FBI data, the average value taken during a robbery is $2,119, which is nearly double compared to larceny ($1,153). Robbery is not the costliest, but it’s right up there with burglary ($2,799) and auto theft ($8,407).
While robberies are on the lower end of the scale in terms of overall value, where the robbery occurs often dictates how much money the thief gets away with. Robberies of homes and banks are by far the most lucrative for criminals.
About one-third of robberies occur on the street, with about 1 in 4 striking a gas station, convenience store or other business and 16.1% taking place inside a residence. By comparison, the majority of burglaries (65.5%) take place at residences.
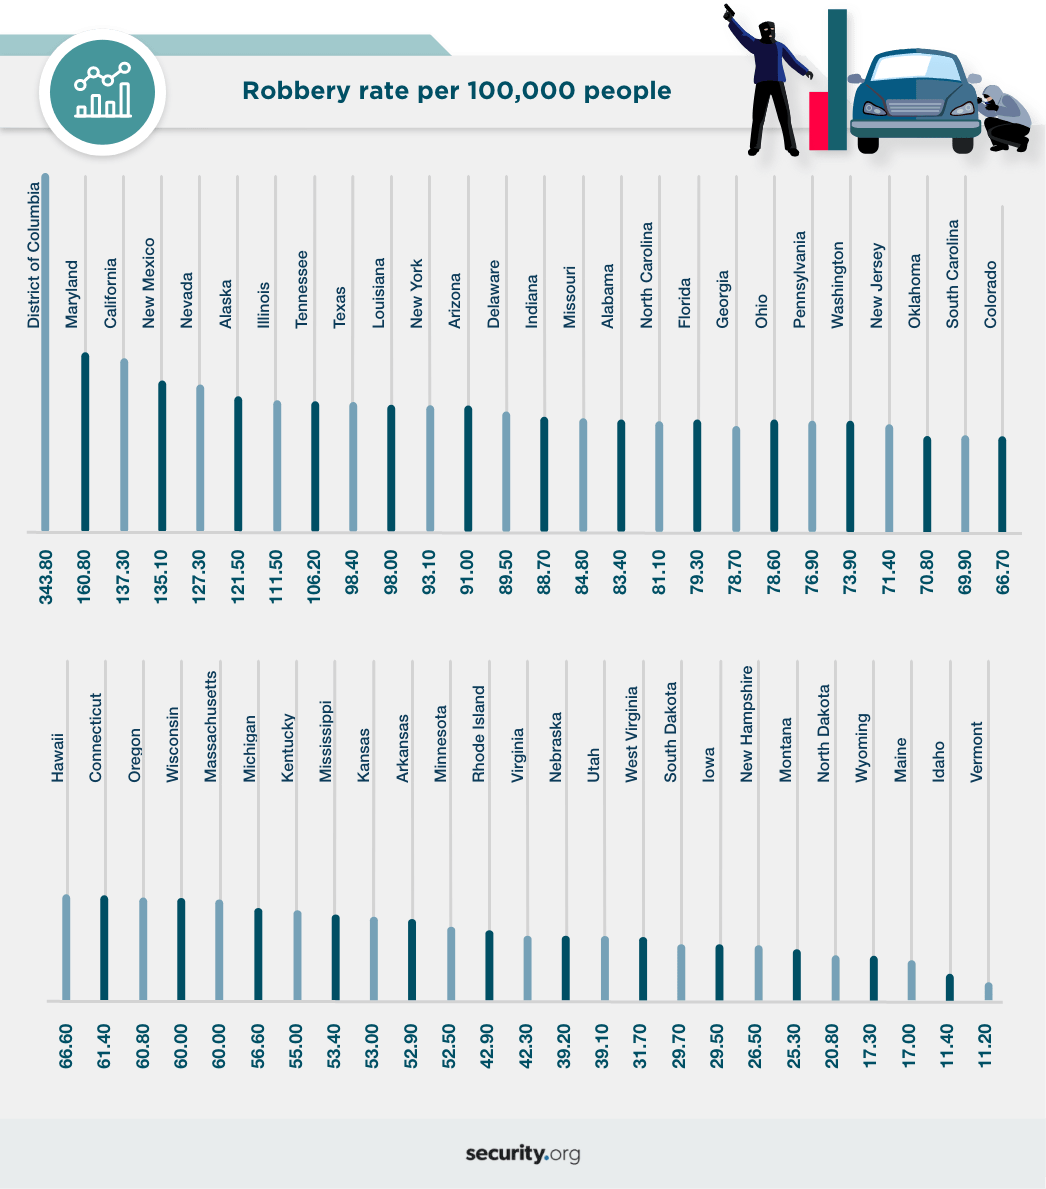
Robbery has become less common in recent years, but the likelihood of being victimized by a robbery depends largely on where you live, and 18 states (plus the District of Columbia) have higher robbery rates than the overall U.S. robbery prevalence, but most states have seen robbery rates fall over the past 10 years. Let’s explore how common robbery is in each state, what types of weapons are used and how the prevalence of the crime has changed in each state over time.
Where Are Rates Highest?
The District of Columbia, which is better compared to a city because of its small nature, has the highest robbery rate by nearly 200 points. Taking the district out of the equation, though, robbery is most common in Maryland, followed by California, New Mexico and Nevada. The lowest robbery rates are in Vermont, Idaho, Maine, Wyoming and North Dakota.
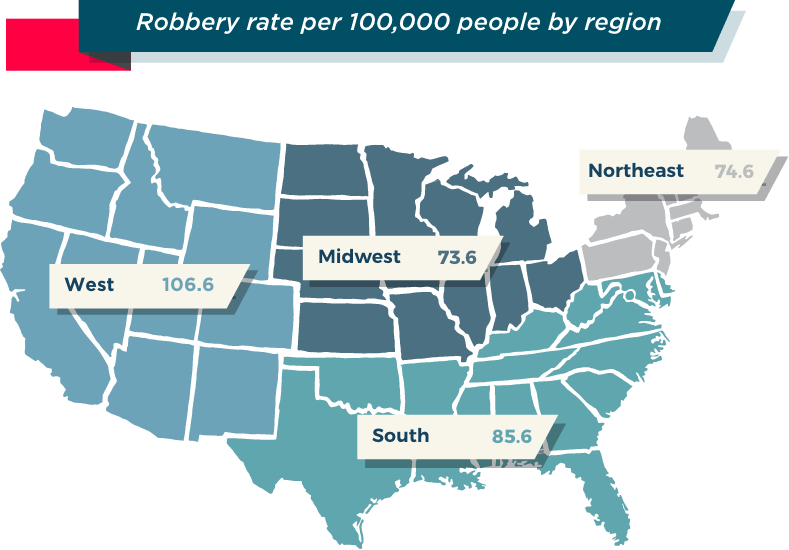
Regionally, robbery rates are highest in the West, with an overall regional rate of 106.6 per 100,000, by far the highest among the regions. The Midwest had the lowest regional robbery rate at 73.6 per 100,000.
What Weapons Are Used?
As opposed to theft, larceny, and vehicle theft, which are property crimes, robbery is a type of violent crime. To be considered a robbery, the incident must involve violence or threat of violence, with or without the use of weapons.
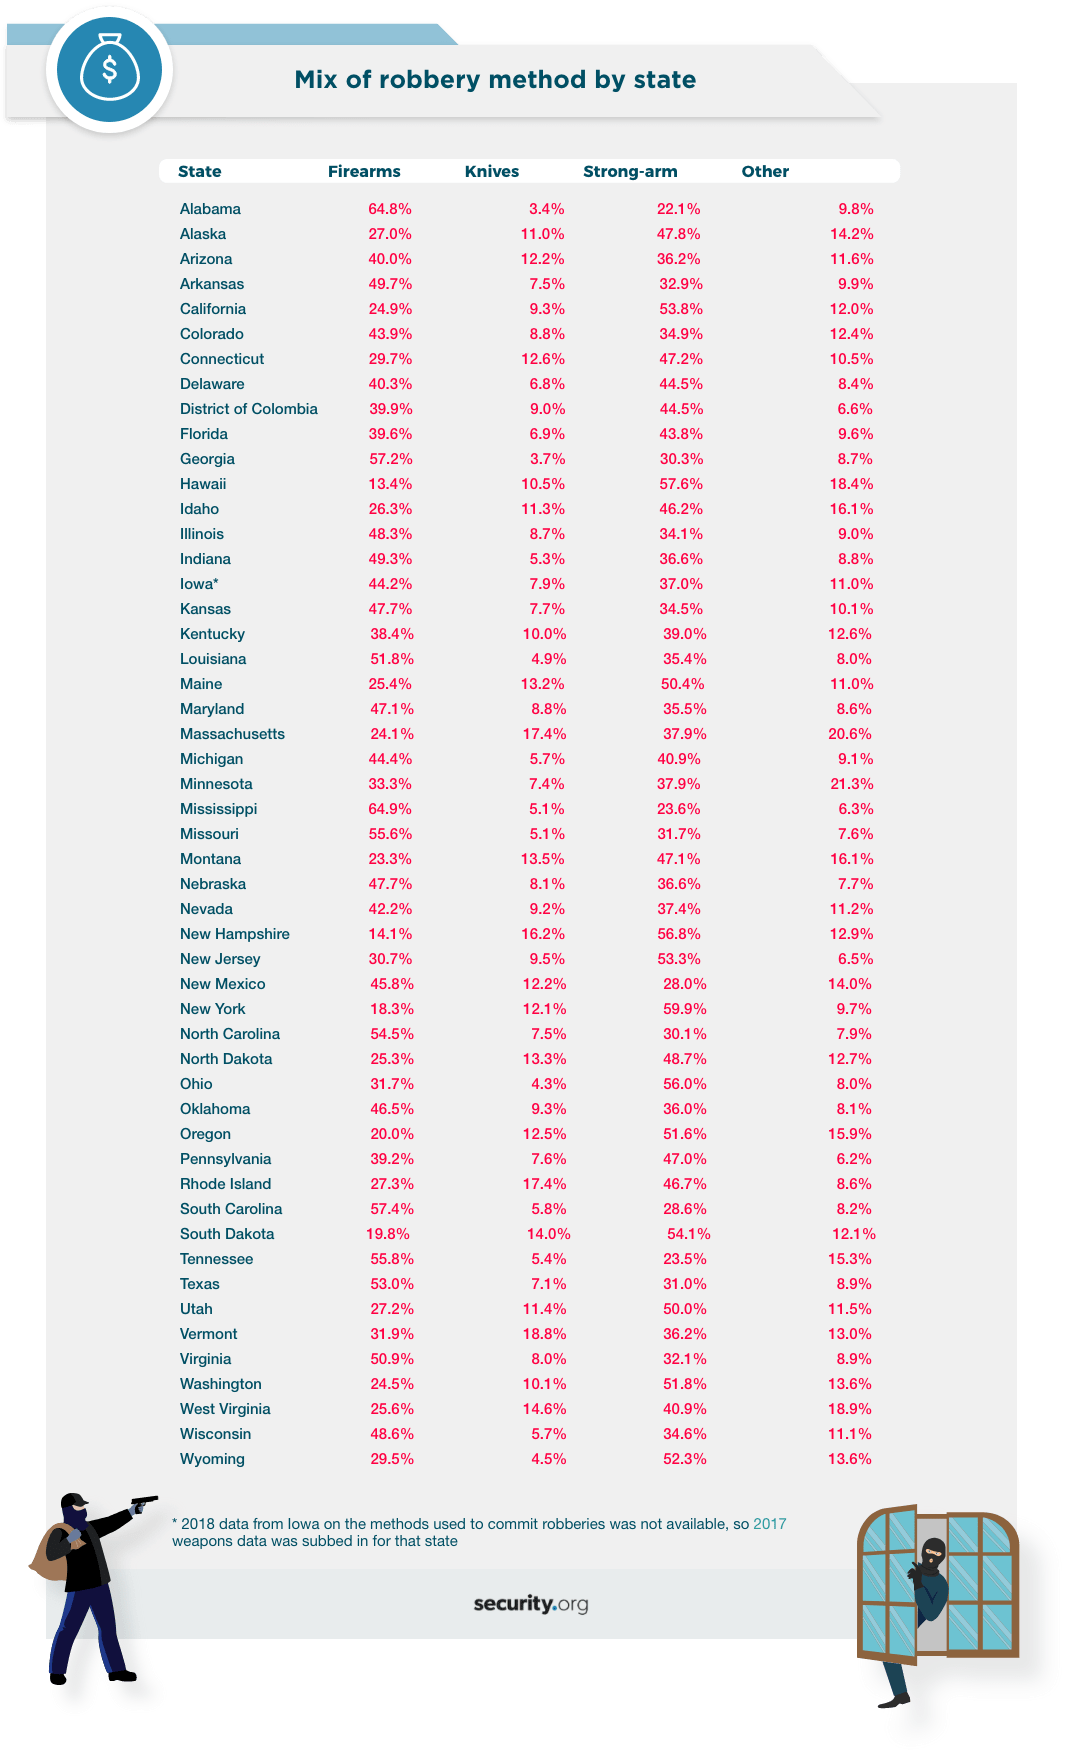
In the case of robberies, about one-third involve a firearm or the threat of one, while another 8.3% involve criminals using knives or other cutting instruments, but nearly 4 in 10 robberies are strong-arm robberies, or incidents in which an attacker uses their own body, such as their hands, fists, even teeth, or the threat of the use of their personal strength.
It’s important to note that an actual theft need not have been completed for an incident to be considered a robbery. For instance, a person fleeing a store with merchandise in-hand who, when confronted by a security guard, punches the guard, drops the merchandise and flees has committed a robbery even though they didn’t actually make off with anything valuable.
The use or threat of firearms in robberies is generally highest in the South, where the five states with the highest proportion of firearms used in robberies are all located, including Mississippi, where nearly two-thirds of robberies involved firearms. Four Northeastern states are among the five states where knives and other cutting instruments are the most popular, with Vermont’s 18.8% of robberies involving knives leading the nation. New York and Hawaii, two very popular tourist destinations, lead the way in strong-arm robberies, with both exceeding 57%.
While guns and knives are the most popular types of non-bodily weapons used, the “other” category is an interesting one that includes things like explosives, pepper spray, acid and brass knuckles, among others.
How Have Things Changed?
Nationally, the robbery rate has fallen from 150.1 per 100,000 in 1999 to 86.2 per 100,000 in 2018, a 20-year drop of 42.6%. Here’s a closer look at the robbery rate by year for the U.S.:
Most crime rates have fallen over the past 10 years, though the declines are not as dramatic as those seen when zooming out to look at the past two decades. Still, it’s hard to argue that Americans have become less safe from most crime over the past 10 years — with one notable exception.
The legacy definition of rape specifies forcible rape; a revised definition includes any penetration of the vagina or anus with any body part. Under the new definition, the rape rate is about 10 points higher, but those statistics only go back to 2013, so for the purposes of an apples-to- apples comparison, we’ve included the data for the outdated definition.
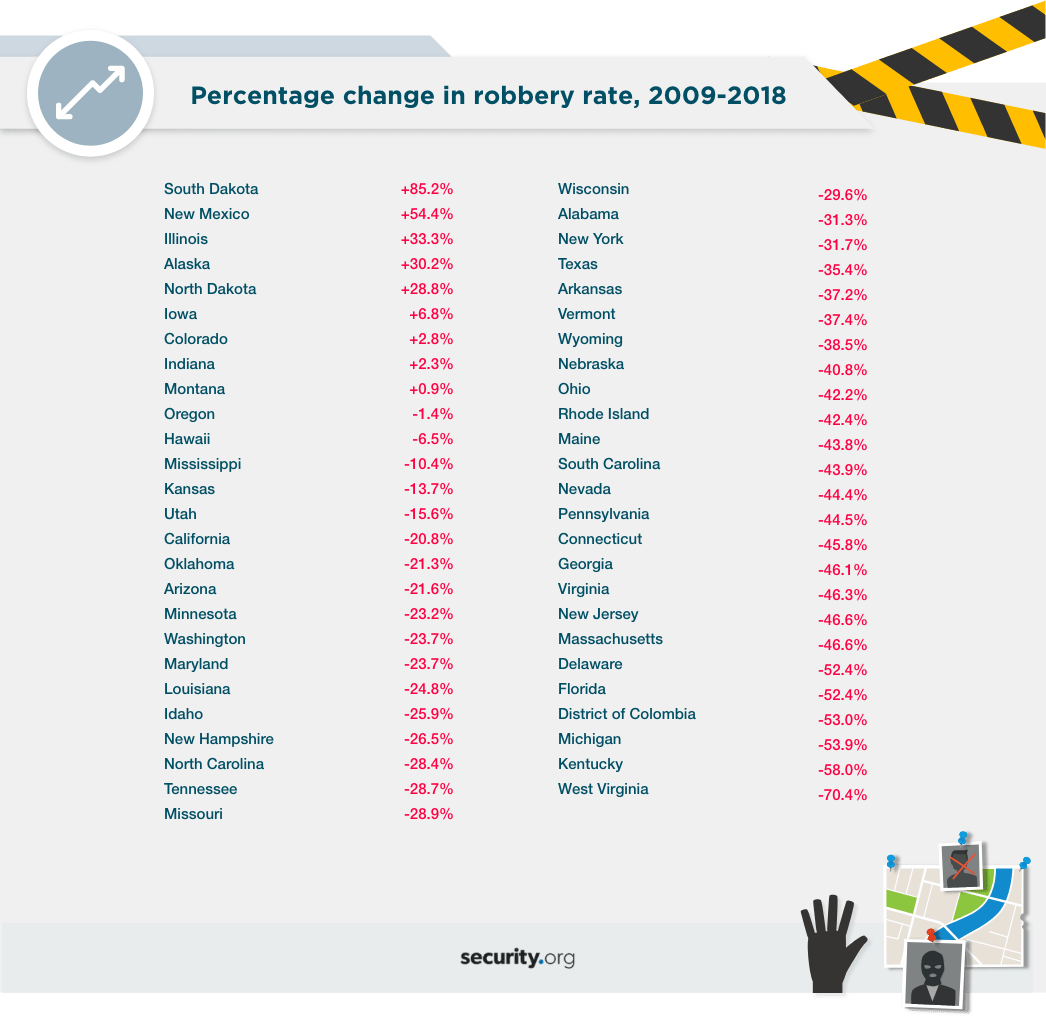
Nine states have seen their robbery rates go up, with South Dakota recording a more than 85% increase during the 10-year period between 2009 and 2018. In that same period, West Virginia saw its robbery rate plummet by about 70%, and most states have seen declines as well, though none as large as the Mountain State’s decline.
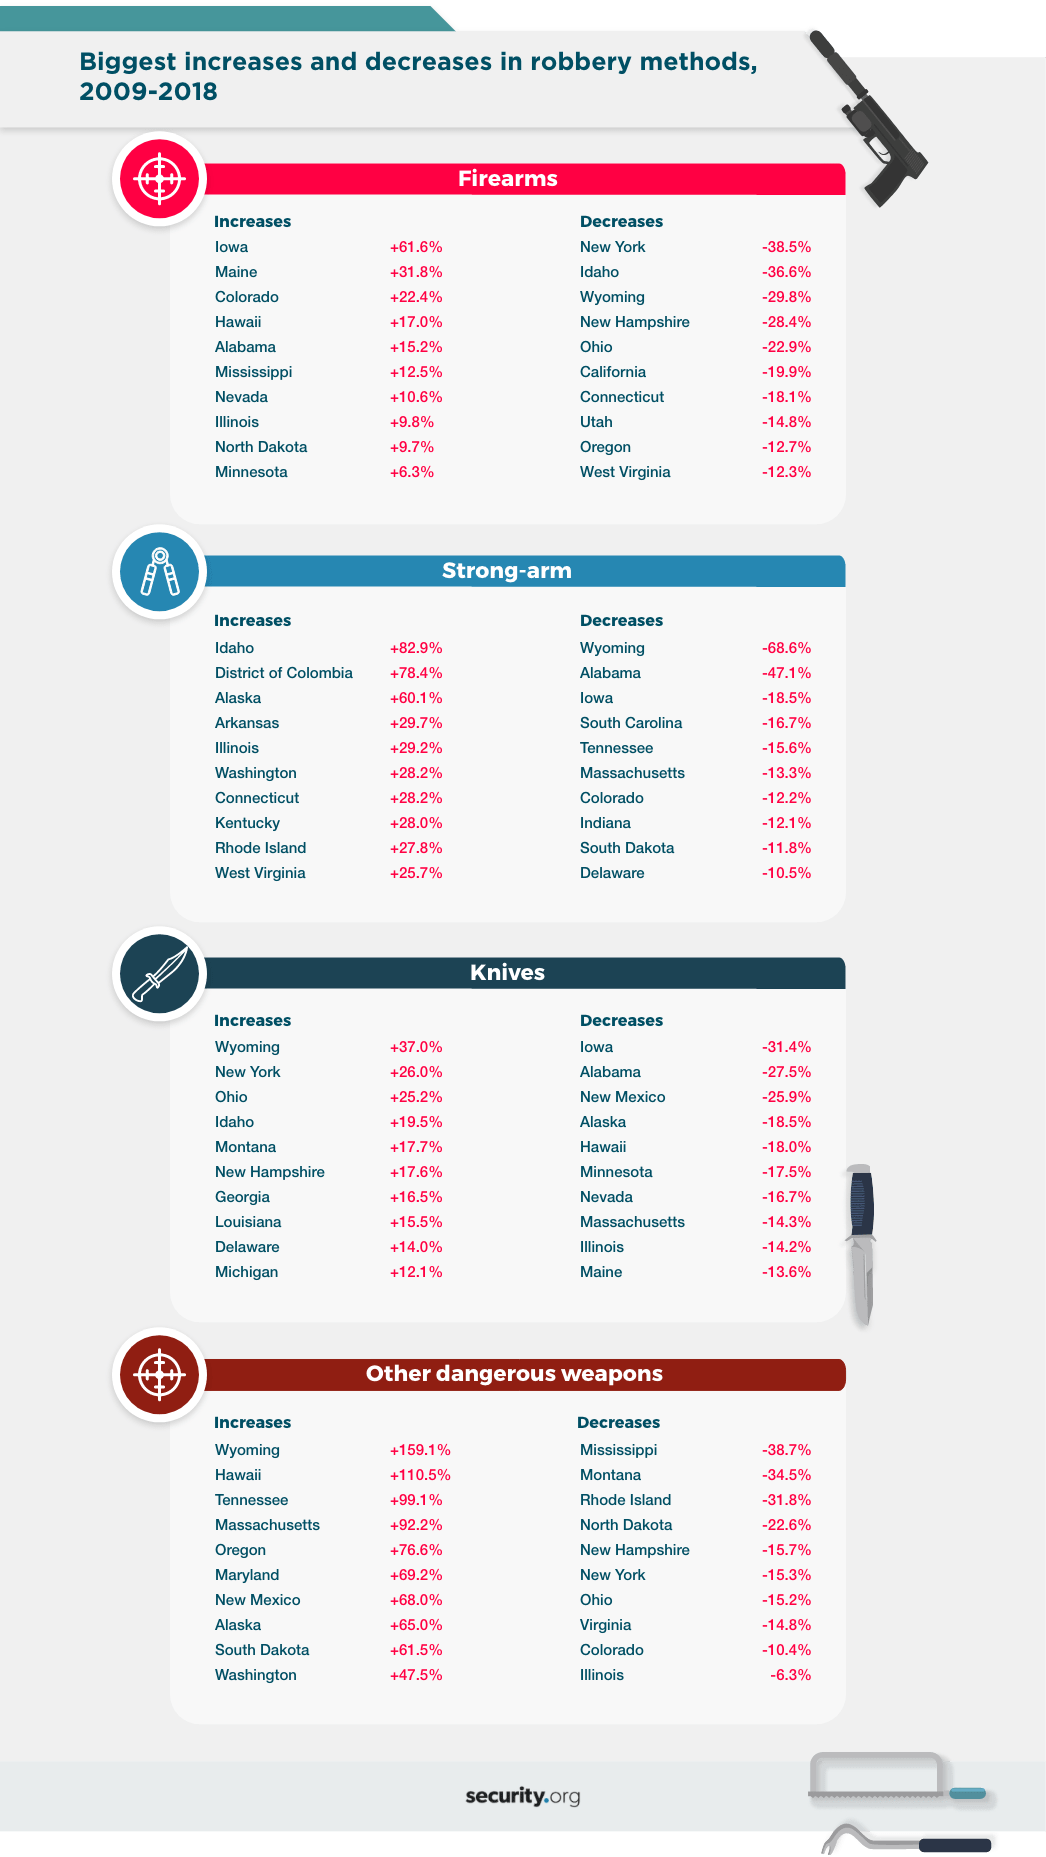
The states have also seen the use of weapons in the commission of robberies change over time, and several changes have been extreme. For instance, Iowa has seen a 61.6% increase in how frequently guns are used in robberies, while Wyoming has seen the use of knives and other cutting instruments fall by more than 68%.
Robberies today are far less common than they were even just five years ago, and their rates have plummeted over the past 20 years. But that doesn’t do much good for people who are falling victim to thieves who commit violence or threaten violence in order to take another person’s property or money. Still, whether you have experienced or are likely to experience a robbery is determined in large part by where you live, and many states have low robbery rates, while most others are making progress against this type of crime.
About This Story
Our analysis of robbery data used figures from the FBI’s annual Crime in the United States reports. The bureau released its complete data for 2018 in the fall of 2019. We have included links to several tables so you can see the hard numbers for yourself, and if you want to dig down even further, you can access nearly a quarter-century of crime data here.
Fair Use Statement
If you’re interested in sharing the analysis or images on this page with your audience, simply provide a link back to the URL of this page. Everything on this page can be shared for noncommercial uses.


