Police Brutality Statistics & Analysis for Cities and States
 Last Updated on Jan 22, 2024
Police brutality is neither new nor rare. We’ve all heard about it in the news. But did you know that the FBI didn’t even begin gathering data on the use of force by police officers until 2019? And the only use-of-force data the FBI covers is the percentage of agencies that send data, not the actual use of force by police across the country.
We’re here to bridge the gap. Since there is no publicly released set of government statistics related to police violence, we turned to a team of researchers who collect and analyze data on police killings, called Mapping Police
What is the state of police violence across the U.S.? How common are police killings, and which cities are most likely to experience police killings? Read on for our analysis of police-violence statistics.
The State of Police Violence
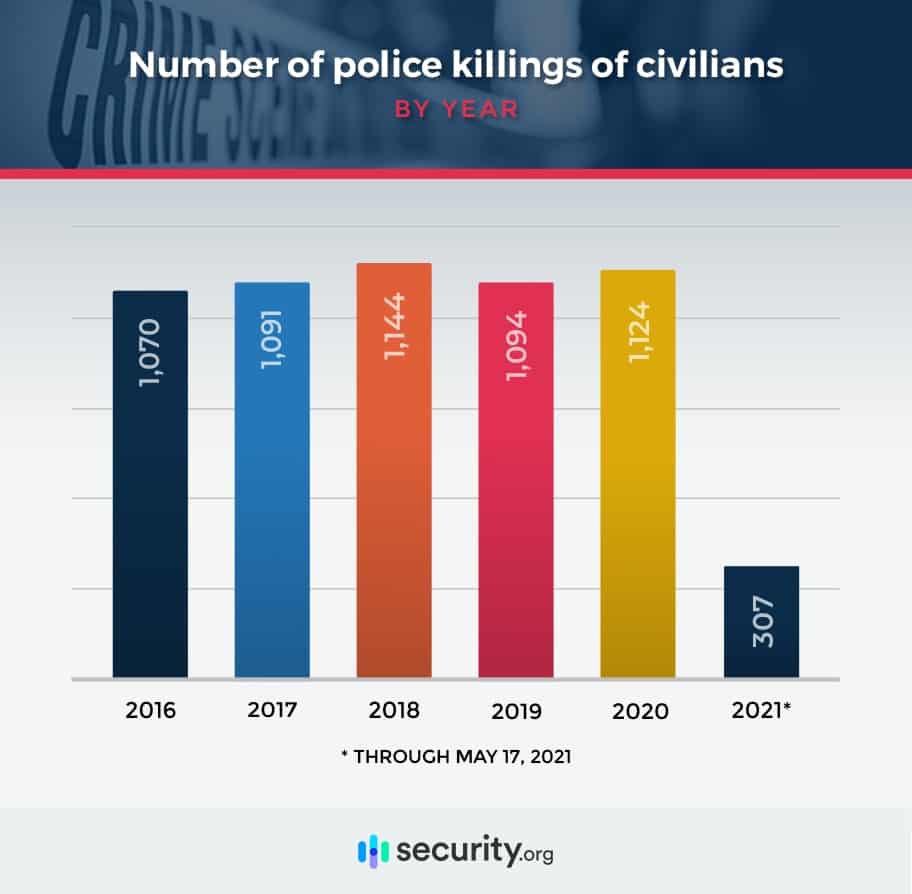
In the first eight years since the data from Mapping Police Violence became available, police in the U.S. killed more than 9,000 people, an average of about 1,095 per year or three people per day.
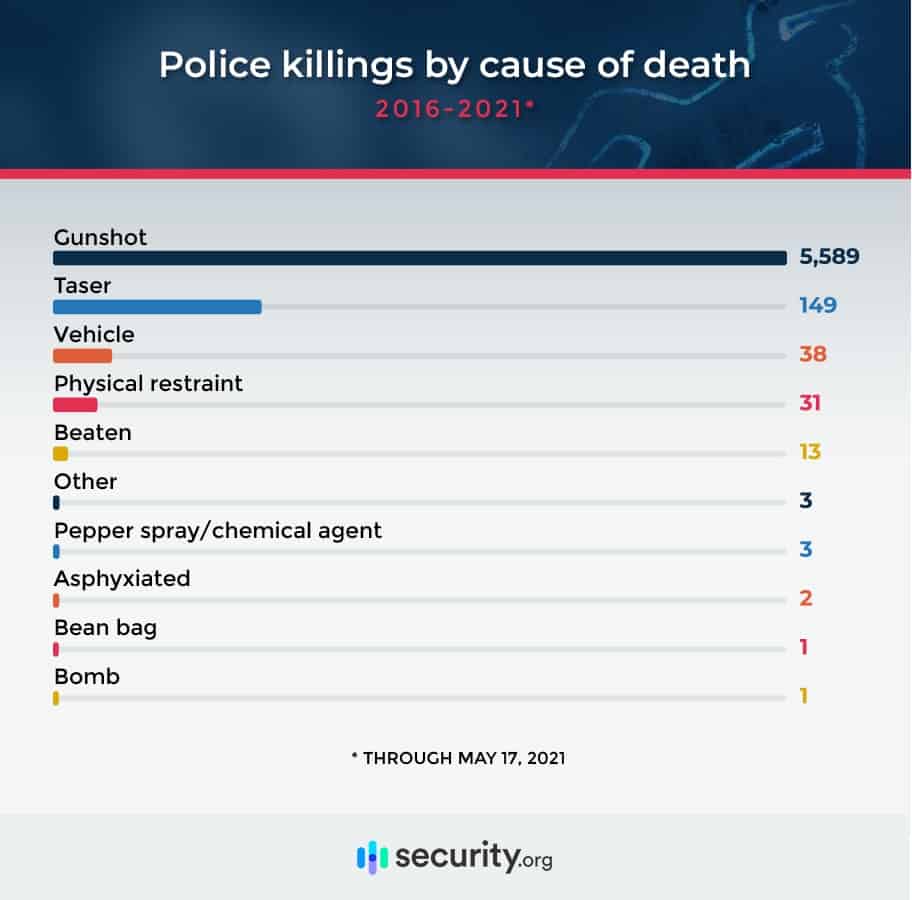
Over the past five years, shootings were the most common cause of these deaths, with gunshots accounting for more than 9 in 10 deaths. Tasers, vehicles, and physical restraint were the next three most common causes.
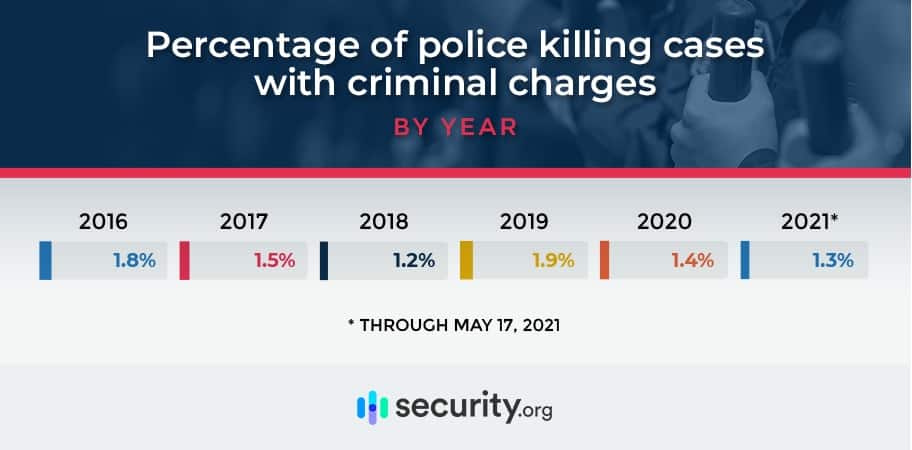
Criminal prosecution for police violence remains incredibly rare. In fact, at no point over the past five years has the rate of criminal charges being filed for police killings exceeded 2 percent of cases.
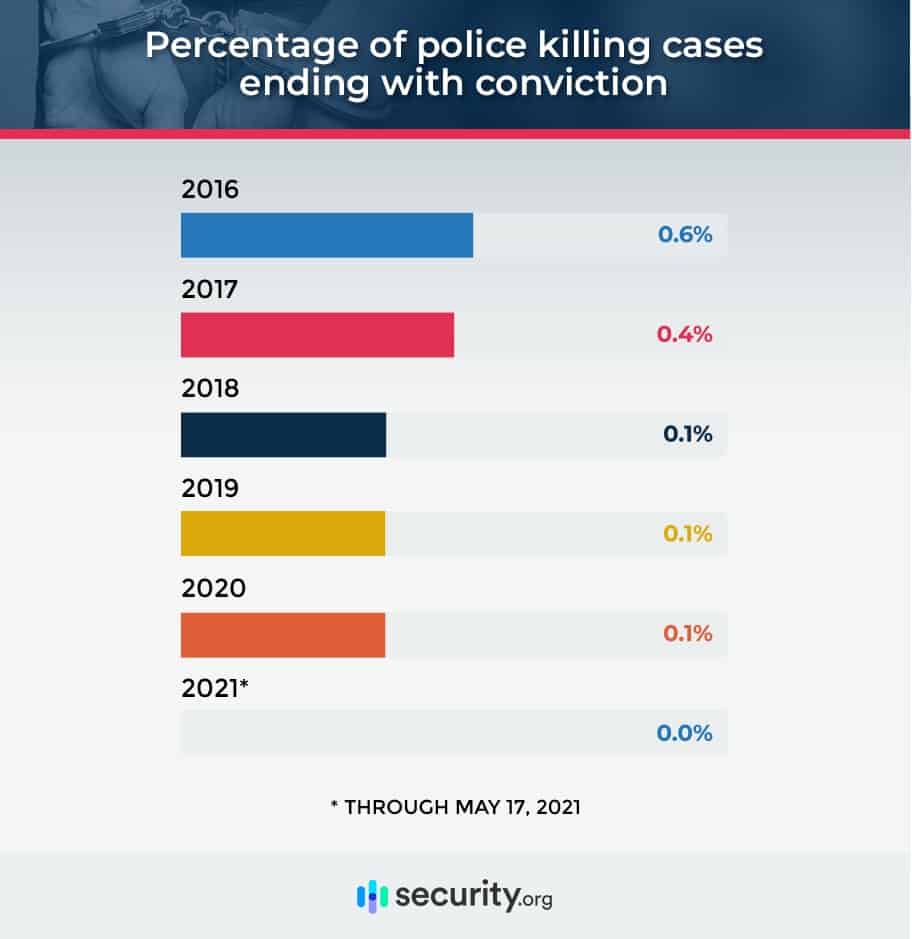
Former Minneapolis police officer Derek Chauvin’s conviction for the murder of George Floyd marked the single instance in 2020 of a police officer being convicted of any charges after killing a person. About a dozen cases of police killings are still working their way through the system.
Even with Chauvin’s conviction, some believe that the only reason he was charged, tried, and convicted of Floyd’s murder was that a bystander recorded the incident. That’s another angle we have to look at: Charging police officers after they take someone’s life requires a high bar, and in many instances, there are factors that shield police officers from prosecution. Among the issues researches raise are public trust in police officers, the code of silence in police agencies, and the murkiness of relationships among police and prosecutors.
Even when an officer is on trial, prosecutors may face uphill battles to convict, said civil rights lawyer David Rudovsky.
“There is a tendency to believe an officer over a civilian, in terms of credibility,” Rudovsky told Vox.2 “And when an officer is on trial, reasonable doubt has a lot of bite. A prosecutor needs a very strong case before a jury will say that somebody we generally trust to protect us has so seriously crossed the line as to be subject to a conviction.”
Cities Where Police Killings Are Most Common
Zooming in on a city level, Los Angeles has seen the highest number of police killings over the past five years with 70. Phoenix comes second with 46, followed by Chicago with 45 people killed by police in the same time period.
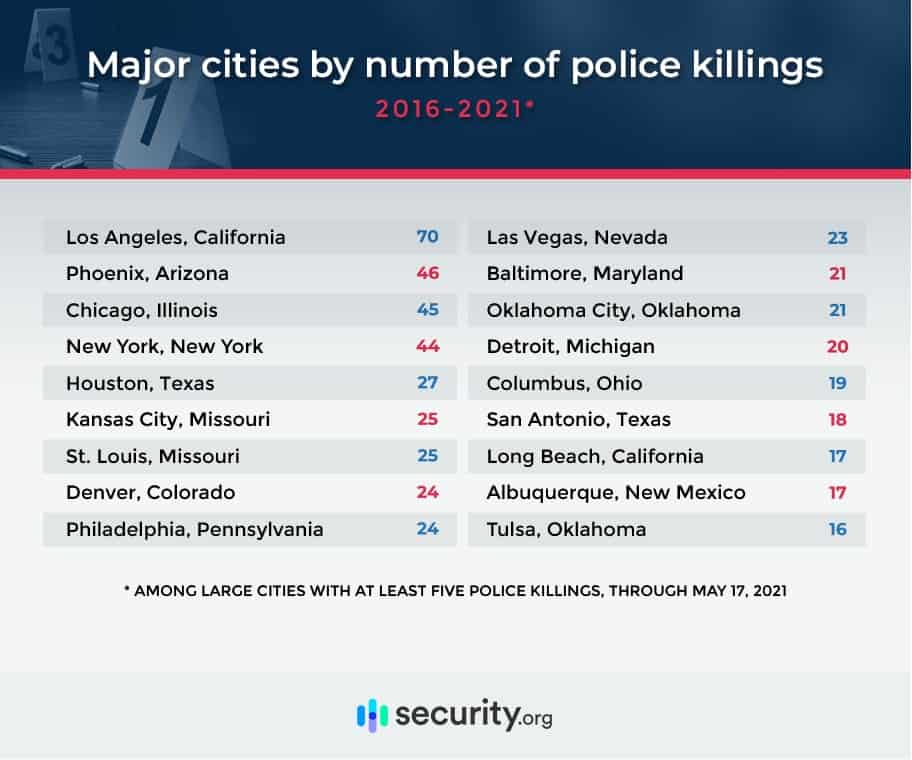
Los Angeles has a particularly grim history when it comes to police violence. The acquittal of five white police officers in the brutal beating of Black motorist Rodney King sparked days of civil unrest in the city. This was fueled in part by the fact that a bystander caught the entire attack on camera.
But decades before the 1992 riots, the city’s predominantly Black neighborhood, Watts, was the site of a five-day skirmish between police and civilians.
Police killings remain common in LA. In fact, a recent in-depth analysis by the Los Angeles Times found that LA County law enforcement has killed at least 928 people since 2001. In that same time, the city has charged only That’s a charge rate of 0.02 percent.
Police killings in Phoenix have also been the subject of public and media scrutiny. A study by The Arizona Republic showed that fatal police shootings in Phoenix surged despite the expansion of the racial and criminal justice movement.
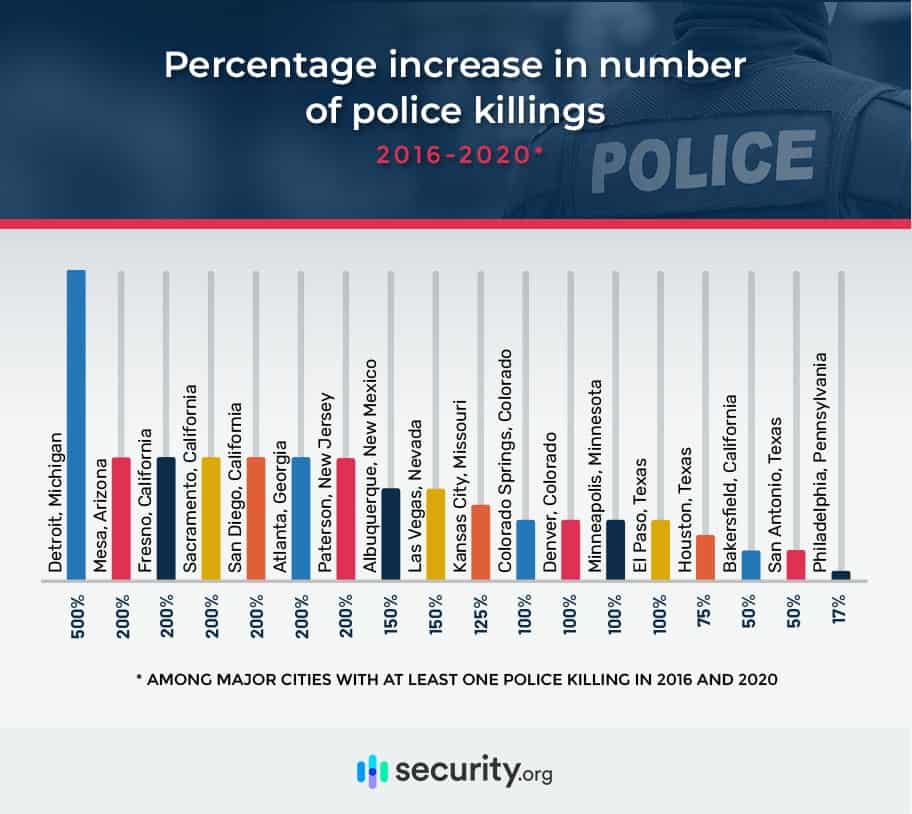
Other cities have seen police killings increase dramatically.4 Among cities with police killings in both 2016 and 2020, the number of fatal law enforcement incidents in Detroit surged by 500 percent.
Accounting for population differences, the deadliest police department in the U.S. in 2020 was the San Bernardino Police Department. The population-adjusted rate of police killings by San Bernardino police was 2.8 per 100,000, almost double the rate of the next-highest department, Kansas City.
According to a Mapping Police Violence analysis of San Bernardino police shootings, the officers involved did not attempt non-deadly force first in 74 percent of shootings.5
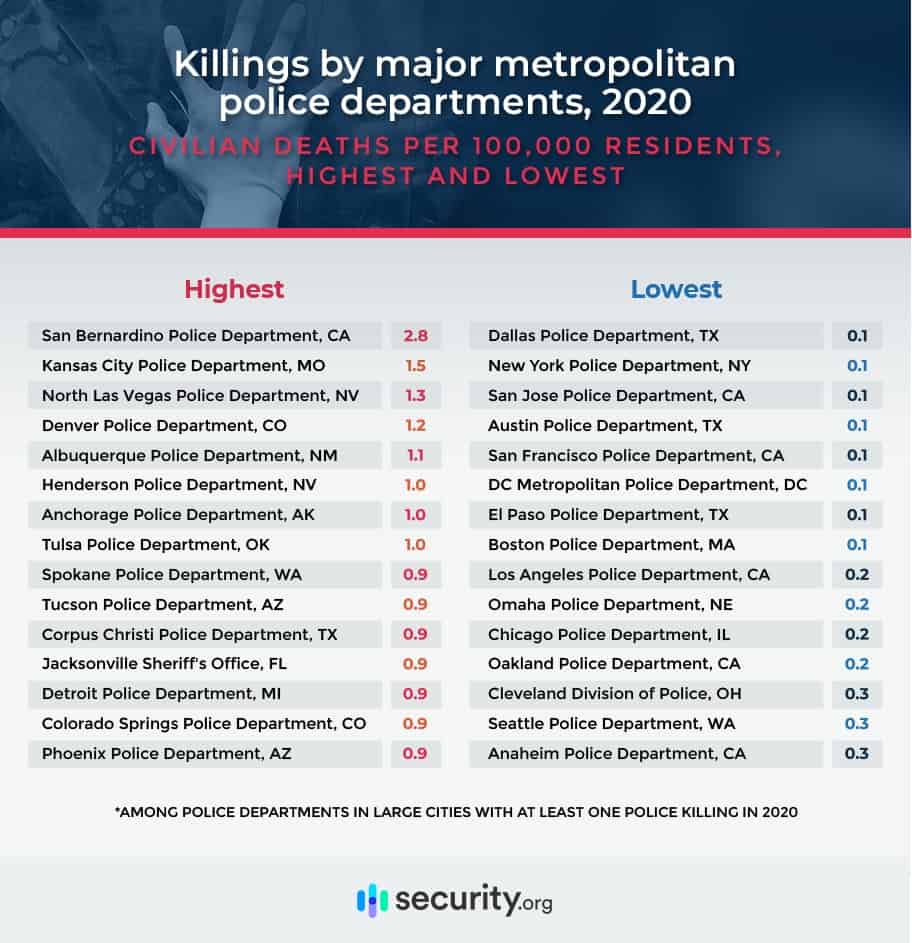
Los Angeles, which had the highest number of killings over the past five years, had one of the lowest population-adjusted rates, while Phoenix had one of the highest.
Racial Disparities in Police Violence
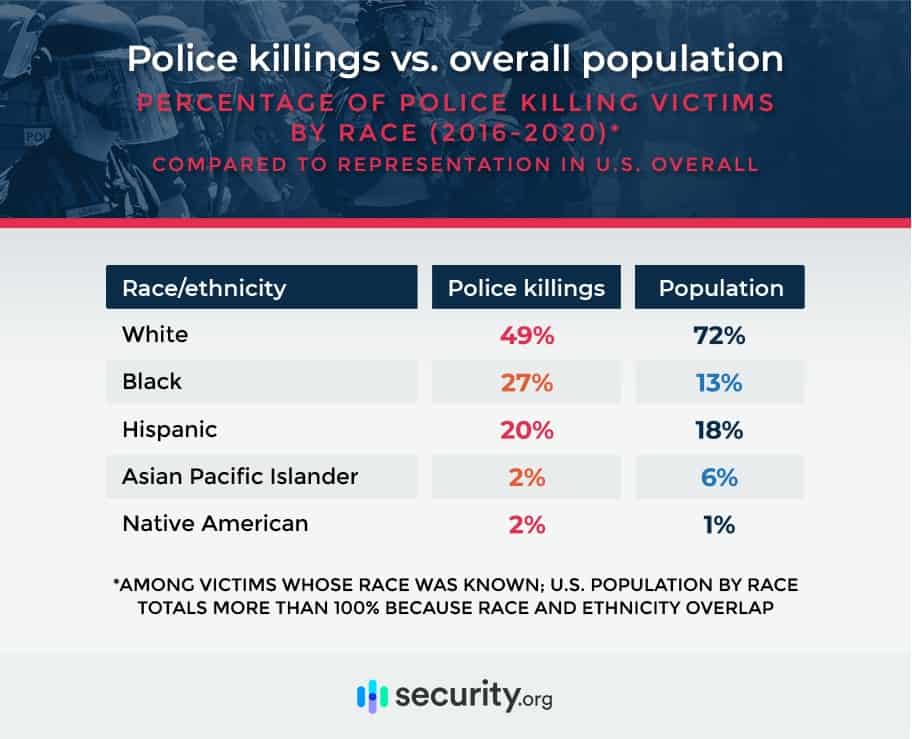
At the heart of the Black Lives Matter movement and the protests after the murder of George Floyd were discrepancies between the rate at which police kill white people and the rate at which they kill Black people, Native Americans, and Hispanic people.
Black Americans make up about 13 percent of the U.S. population, but they account for more than 1 in 4 people killed by police. Hispanic and Native American people are also overrepresented in police killings. Asian/Pacific Islanders and whites are the only ethnic groups underrepresented in police killings.
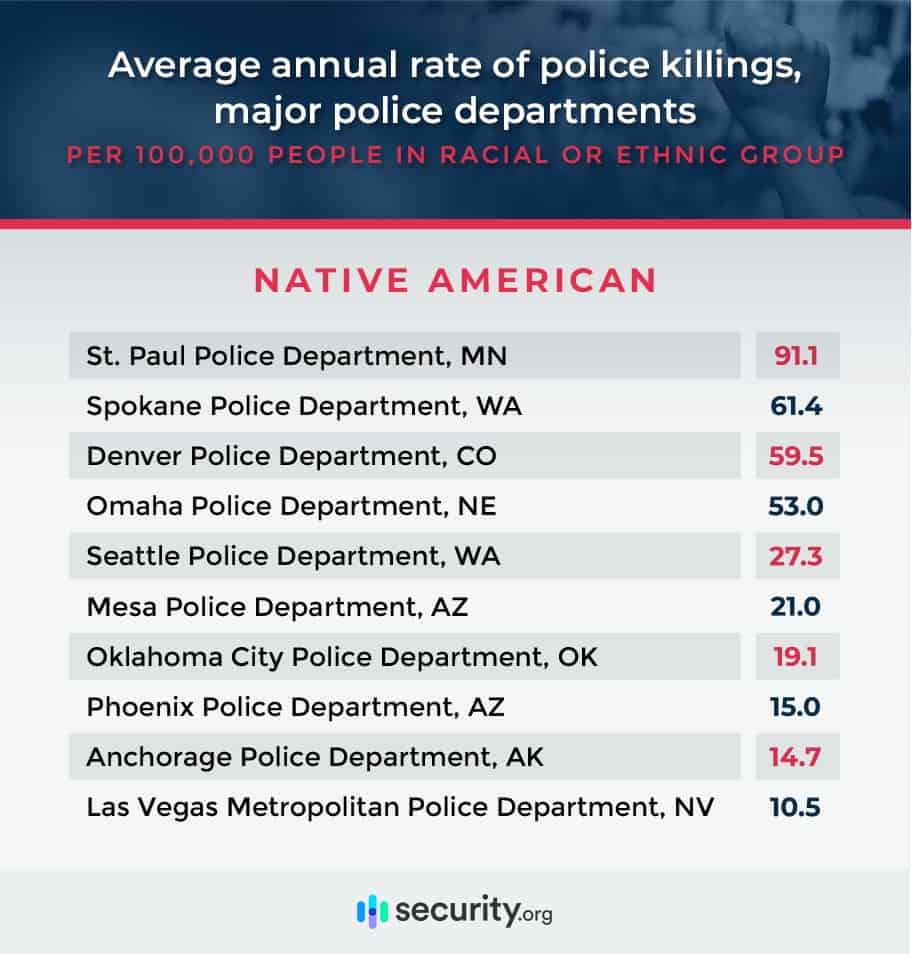
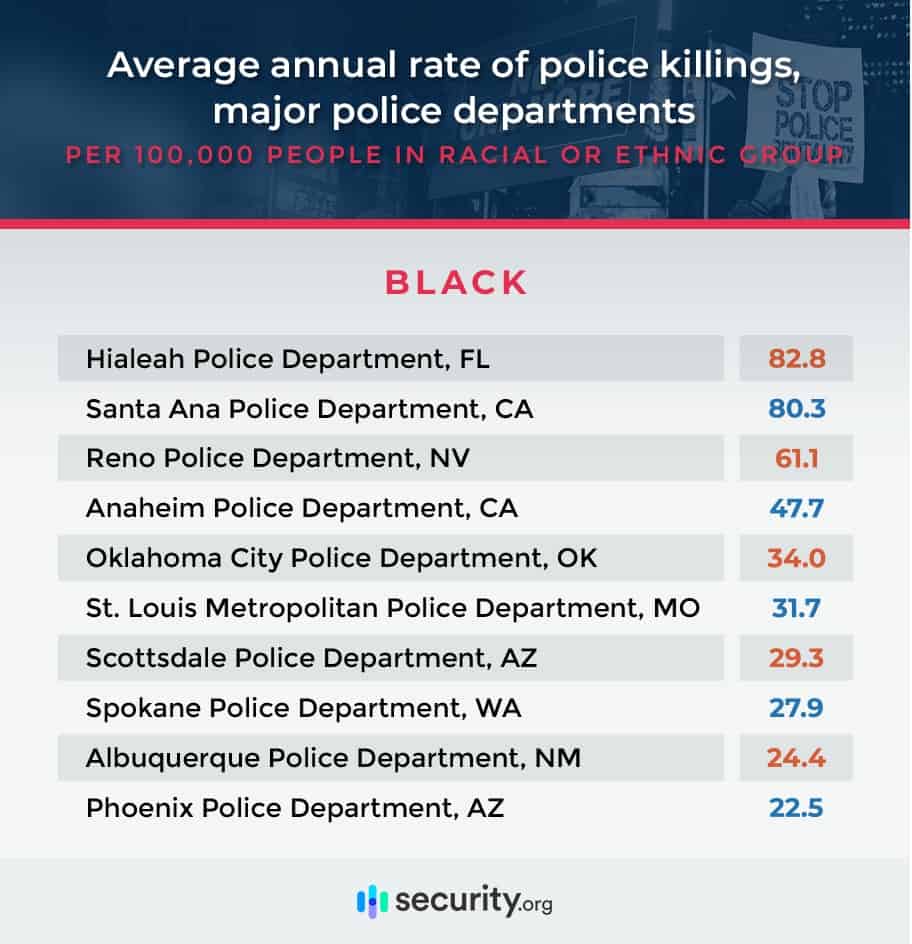
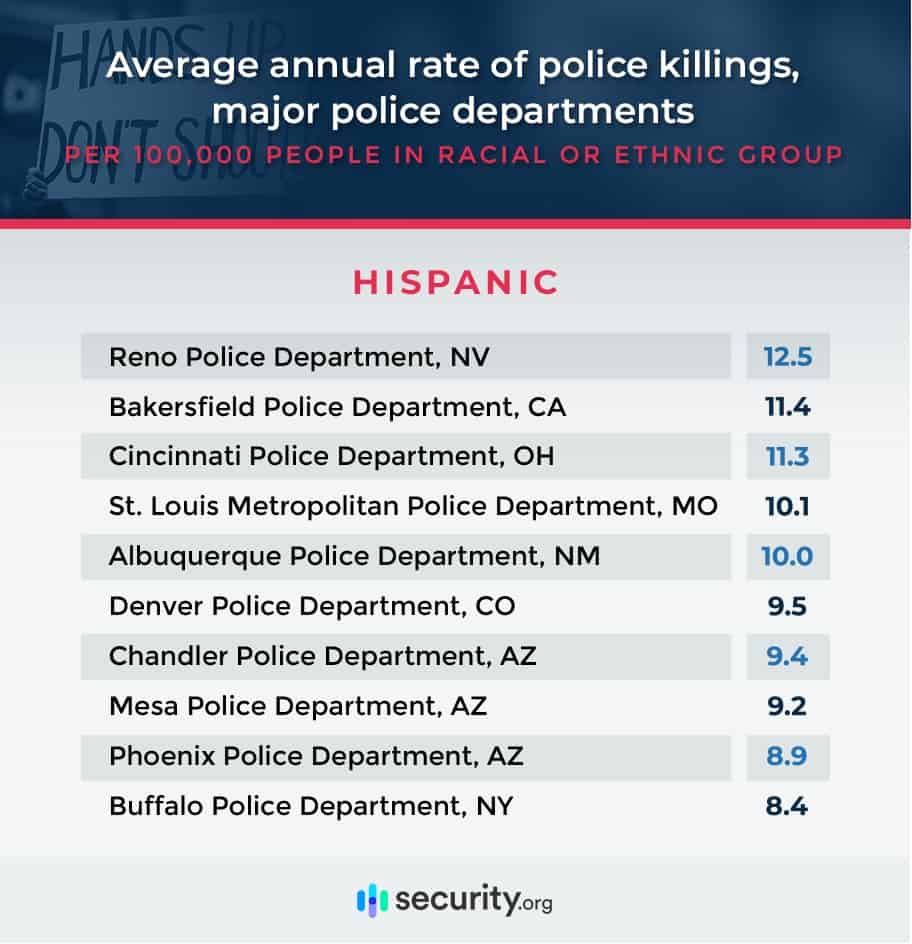
In the U.S., homicide generally occurs at a rate of about 5 per 100,000 people, but many police departments’ rates of police killings far exceed that for certain ethnic groups.
Phoenix police most consistently have high population-adjusted rates of killings of Black, Hispanic, and Native American people. In fact, the department appears in the top 10 for the rate at which police killed individuals in all three groups. Police in Albuquerque, Denver, Mesa, Oklahoma City, Reno, Spokane, and St. Louis all appear in the top 10 for these two racial groups.
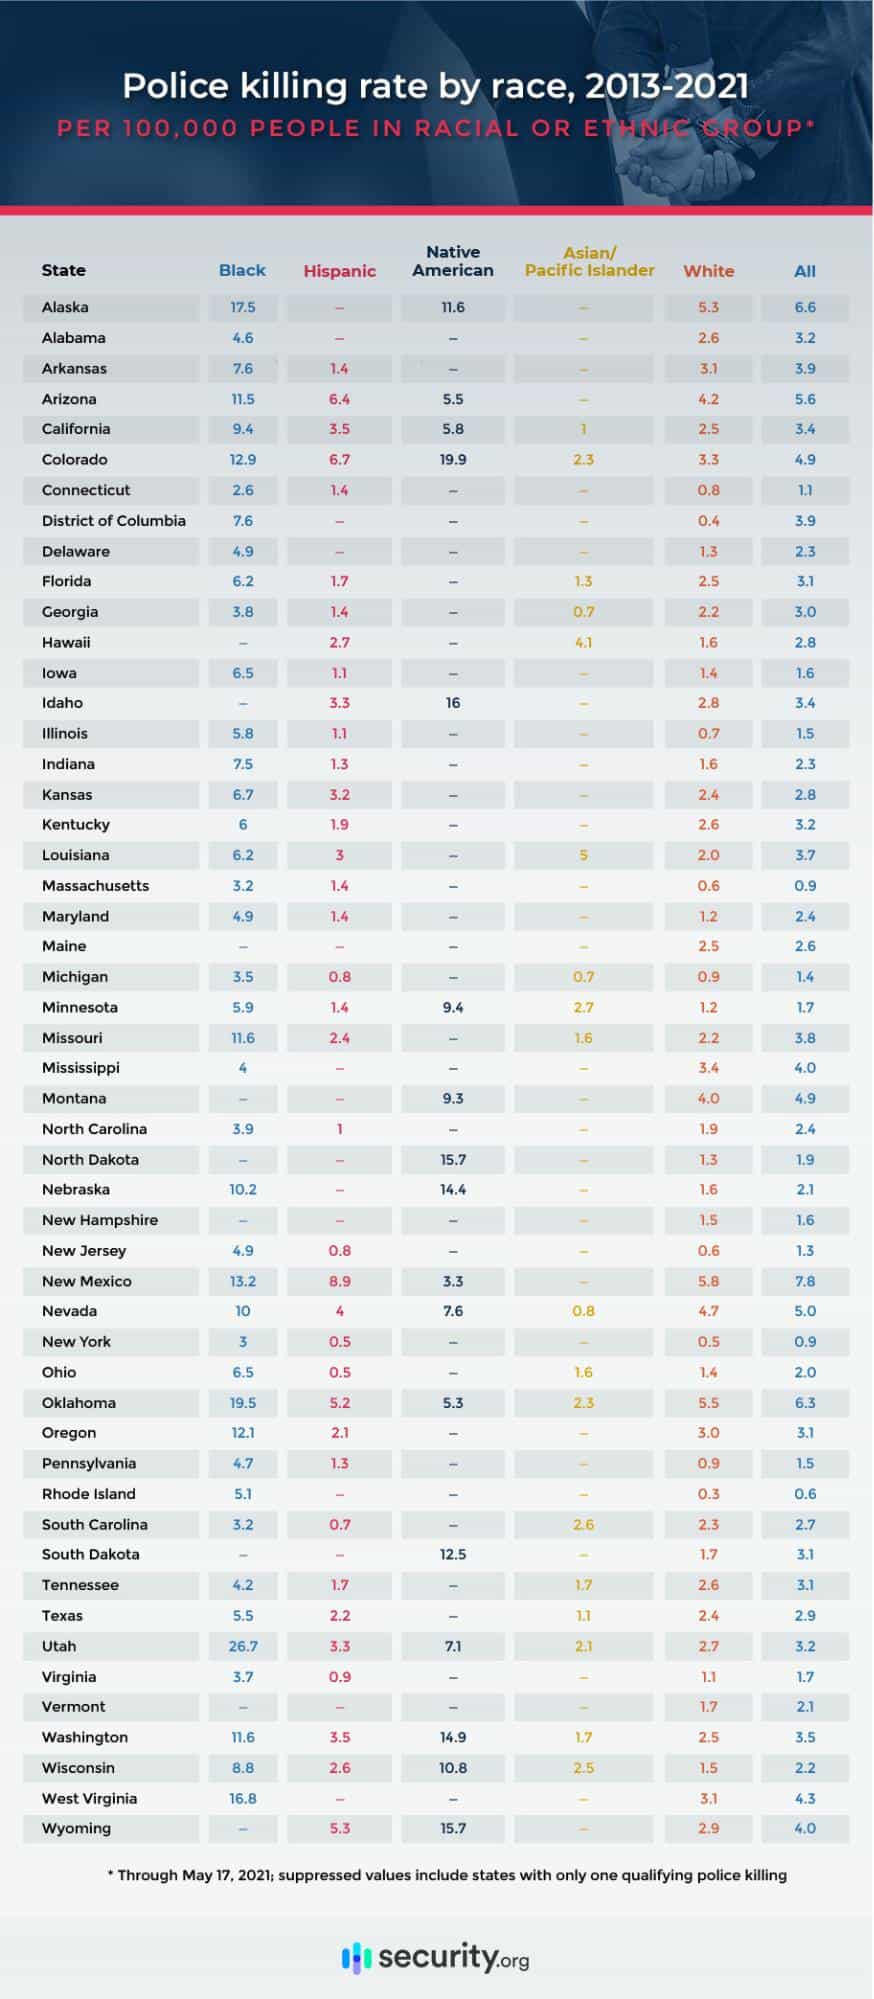
Zooming out to the state level, in almost all states, the rate at which police kill Black people is far higher than the rate at which they kill white people. In some cases, the differences in fatal encounters with police in the U.S. are startling.
In Utah, for example, police have killed Black people at a rate of 26.7 per 100,000, compared with 2.7 per 100,000 for white people. West Virginia, Oklahoma, and Alaska all have disparities in the double digits.
Colorado, Idaho, North Dakota, Nebraska, South Dakota, and Washington all have disparities between the rates of killings of Native Americans and white people, though fewer states had qualifying incidents. To avoid skewing data too heavily, we excluded states that had only one police killing of someone in the ethnic group.
No state had double-digit disparities between Hispanic people and white people.
Conclusion
While there’s room for debate over policy interventions that might limit the number of police killings, there’s inadequate accountability or scrutiny for these incidents.
When police kill a civilian, the initial assumption by some is that the incident was justified, while others automatically assume it wasn’t. While the truth may be somewhere in between, the public can’t possibly make informed decisions without cold, hard facts.
And the facts undeniably show several things:
- Police kill about 1,000 civilians every year.
- In almost every corner of the country, police kill Black, Native American, and Hispanic people at higher rates than white people.
- Officers rarely face legal accountability.
References
- https://mappingpoliceviolence.org/
- https://www.vox.com/21497089/derek-chauvin-george-floyd-trial-police-prosecutions-black-lives-matter
- https://www.latimes.com/projects/los-angeles-police-killings-database/
- https://www.azcentral.com/story/news/local/arizona/2021/02/01/arizona-police-shootings-up-2020-but-less-fatal-phoenix/4204679001/
- https://policescorecard.org/ca/police-department/san-bernardino